
설명
CVD ai
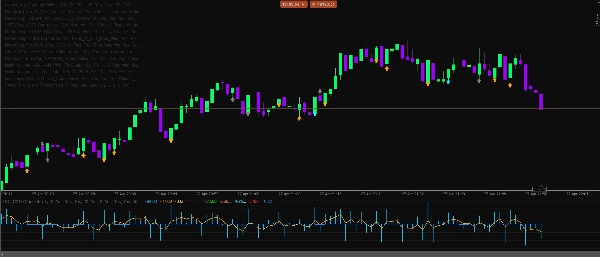
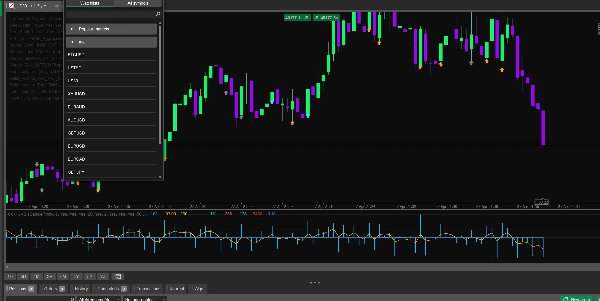
Delta CVD Advanced는 시장 행동에서 직접 매수 및 매도 압력을 더 명확하게 파악하고자 하는 트레이더를 위해 설계된 전문 모멘텀 및 주문 분석 지표입니다. 이 지표는 Delta, CVD, 실시간 틱 모멘텀, 흡수, 발산, 세션 필터, 변동성 가드 및 스마트 컨플루언스 엔진을 하나의 깔끔한 분석 도구로 결합합니다.
이 지표는 외환, 금, 지수, 암호화폐 및 석유 시장에서 스캘핑, 일중 거래 및 단기 모멘텀 확인을 위해 제작되었습니다.
주요 기능
- 업틱/다운틱 논리를 사용한 실시간 Delta 계산
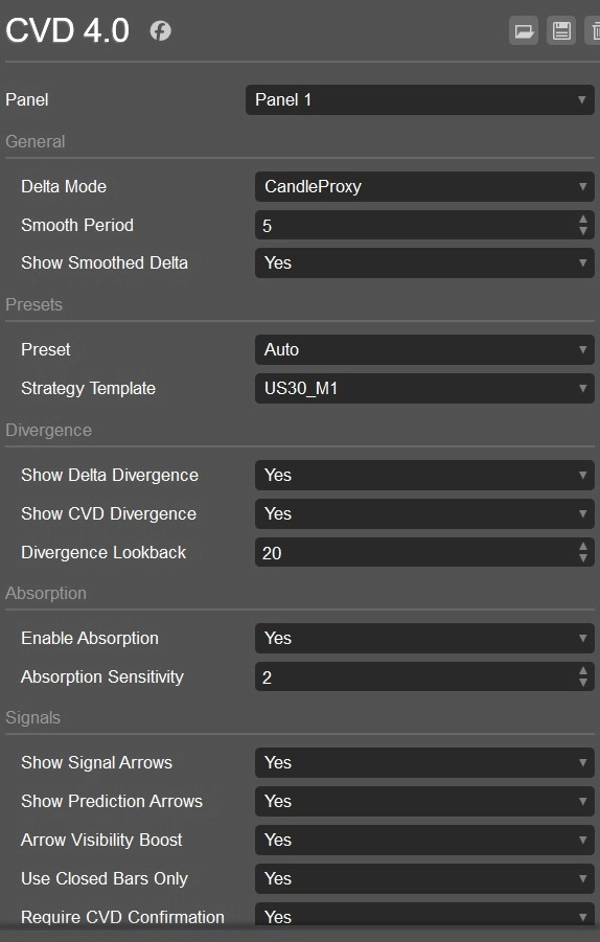
- 과거 분석을 위한 캔들 프록시 델타 모드
- 시간 경과에 따른 압력을 추적하는 누적 거래량 델타 라인
- 더 깔끔한 모멘텀 판독을 위한 스무딩된 Delta 라인
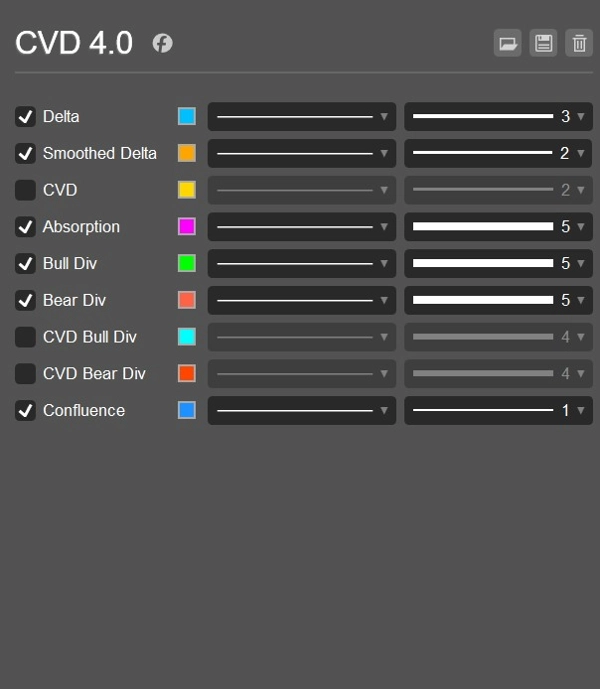
- 매수/매도 색상 구분 Delta 히스토그램
- 실시간 시장 임펄스를 위한 틱 기반 모멘텀 계산
- CVD 기울기와 틱 임펄스를 결합한 하이브리드 모멘텀 모드
- CVD 리셋 옵션: 없음, 일간, 또는 세션별
- 강세 및 약세 Delta 발산 감지
- 강세 및 약세 CVD 발산 감지
- 가격 변동을 유발하지 못하는 압력 탐지를 위한 흡수 감지
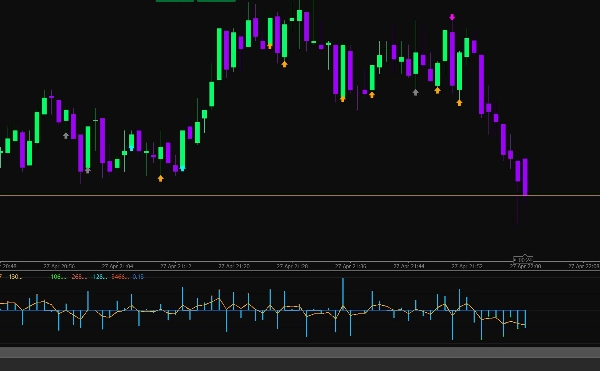
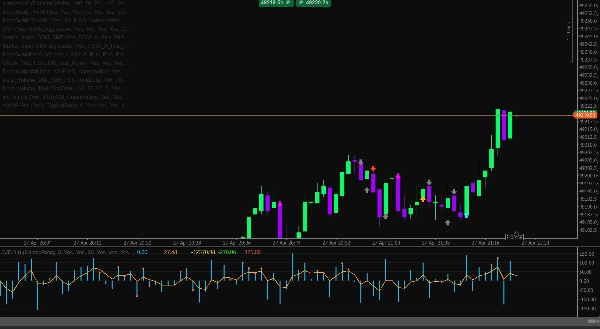
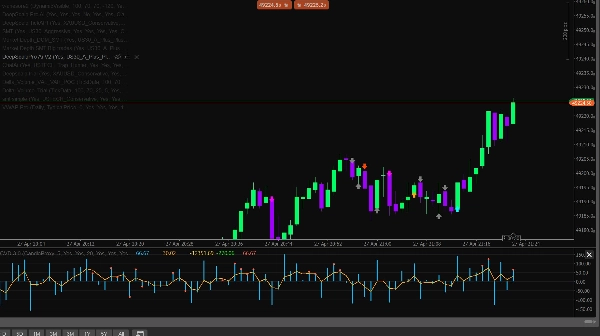
- 매수 및 매도 기회를 위한 신호 화살표
- 초기 모멘텀 변화 경고를 위한 예측 화살표
- 신호에 대한 선택적 CVD 확인
- 방향성 점수를 갖춘 스마트 컨플루언스 엔진
- DOM 프록시 압력 필터
- 유동성 확보를 위한 스윕 감지 필터
- 아시아, 런던, 뉴욕 세션 필터
- UTC 시간을 이용한 자동 세션 감지
- ATR 한계를 이용한 변동성 가드
- 열악한 시장 상황을 피하기 위한 스프레드 가드
- 약한 저거래량 신호를 피하기 위한 거래량 비율 필터
- 외환, 금, 지수, 암호화폐, 석유용 심볼 프리셋
- US30 M1, USTECH M1, XAUUSD M1, BTCUSD M1, Oil M1 전략 템플릿
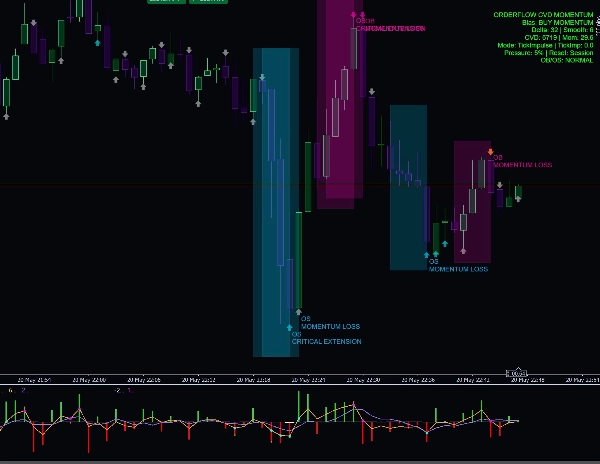
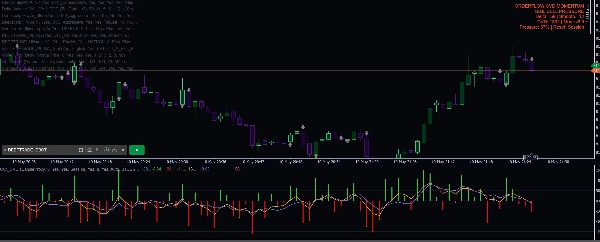
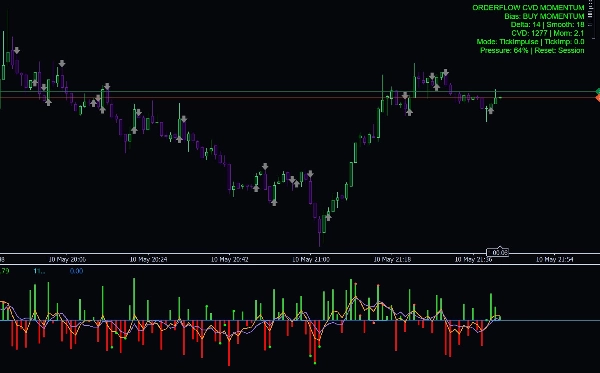
- 편향, Delta, 스무딩된 Delta, CVD, 모멘텀, 압력 백분율 및 리셋 모드를 보여주는 정보 대시보드
- 쿨다운 제어가 가능한 선택적 로그 알림
트레이더들이 사용하는 이유
Delta CVD Advanced는 현재 누가 시장을 지배하고 있는지, 즉 매수자 또는 매도자를 이해하는 데 도움을 줍니다. 가격 캔들에만 의존하는 대신, 이 지표는 움직임 뒤에 있는 압력을 분석합니다. 이는 진입 확인, 약한 신호 회피, 반전 식별, 흡수 탐지 및 가격에 명확히 나타나기 전에 모멘텀 변화를 감지하는 데 유용합니다.
틱 모멘텀 모드는 실시간 가격 임펄스에 반응하기 때문에 라이브 스캘핑에 특히 유용하며, CVD 및 스무딩된 델타 도구는 움직임에 실제 강도가 있는지 확인하는 데 도움을 줍니다.
최적 사용 대상
- 스캘핑
- 일중 거래
- 모멘텀 확인
- 반전 확인
- 유동성 스윕 분석
- Delta 및 CVD 발산 거래
- 금, 지수, 암호화폐, 석유 및 외환 페어
- M1, M5 및 기타 낮은 시간대
중요 공지
이 지표는 분석적 의사결정 지원 도구입니다. 수익을 보장하지 않으며 적절한 위험 관리, 시장 구조 및 검증된 거래 계획과 함께 사용해야 합니다.
요약
AI 요약
CVD Ai is an advanced Volume Spread Analysis (VSA) and Cumulative Volume Delta (CVD) indicator designed to analyze buying and selling pressure in financial markets. It integrates multiple analytical tools including live Delta calculation based on uptick/downtick logic, candle proxy delta for historical data, smoothed Delta lines, and a cumulative volume delta line to track market pressure over time. The indicator features buy/sell colored Delta histograms, tick-based momentum calculations, and a hybrid momentum mode combining CVD slope with tick impulse.
Additional functionalities include detection of bullish and bearish Delta and CVD divergences, absorption detection to identify pressure that fails to move price, and signal arrows for buy/sell opportunities alongside prediction arrows for early momentum shifts. It incorporates session filters for Asia, London, and New York trading sessions, volatility and spread guards, volume ratio filters, and a smart confluence engine with directional scoring.
CVD Ai supports markets such as Forex, Gold, Indices, Crypto, and Oil, and is optimized for scalping, intraday trading, and short-term momentum confirmation on lower timeframes like M1 and M5. It offers strategy templates for specific symbols including US30, USTECH, XAUUSD, BTCUSD, and Oil. The indicator includes an info dashboard displaying bias, Delta, smoothed Delta, CVD, momentum, pressure percentage, and reset mode options.
지표 프로필
고객 리뷰
4.0
리뷰: 2
5 | 0 % | |
4 | 100 % | |
3 | 0 % | |
2 | 0 % | |
1 | 0 % |
고객 리뷰
February 12, 2026
the first 10 trades should stay boring, and The log becomes easier to read.
February 11, 2026
M15 is enough for the first pass. The rules are easier to keep in view.
상담
자주 묻는 질문(FAQ)
Signal
Indices
Supertrend
NZDUSD
AI
NAS100
ATR
트레이딩 봇, 지표, 플러그인 등 cTrader Store에서 제공되는 상품은 제3자 개발자에 의해 제공되며, 이는 단순히 정보 및 기술적 접근을 목적으로 제공된 것입니다. cTrader Store는 중개인이 아니며, 투자 조언, 개인별 추천 또는 향후 성과에 대한 어떠한 보장도 제공하지 않습니다.
이 작성자의 상품 더 보기


가격
6
판매
691
무료 설치