คำอธิบาย
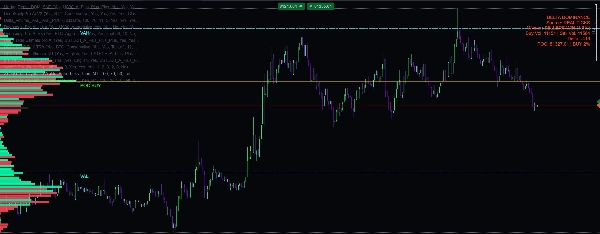
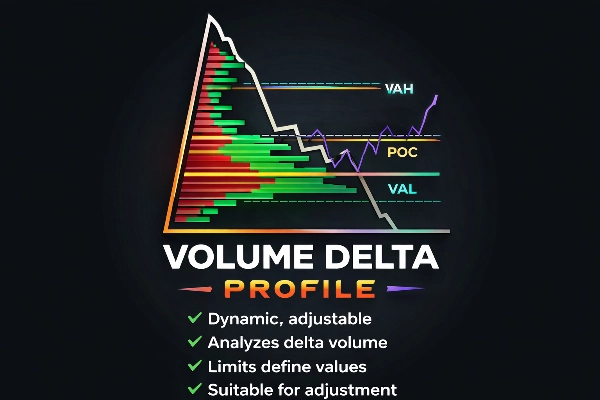
โปรไฟล์เดลตาปริมาณ
ข้อมูลเชิงลึกการไหลของคำสั่งสำหรับนักเทรดขั้นสูง
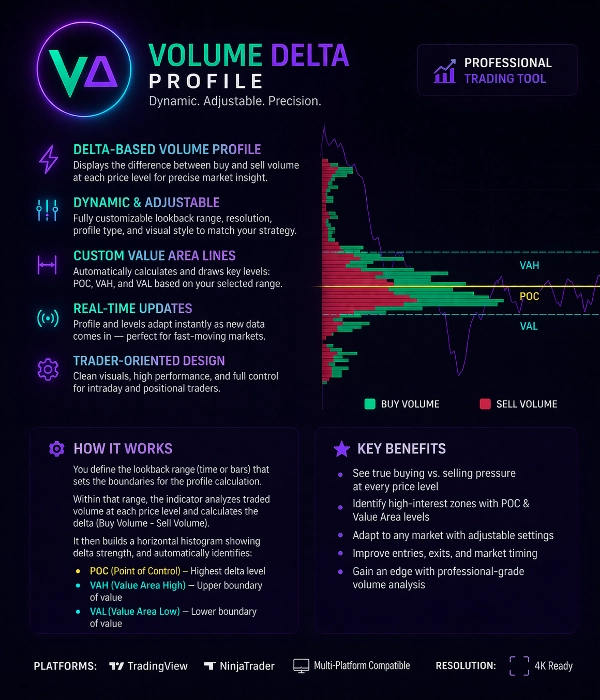
โปรไฟล์เดลตาปริมาณเป็นเครื่องมือการเทรดที่ทรงพลังซึ่งออกแบบมาเพื่อเปิดเผย สมดุลที่แท้จริงระหว่างผู้ซื้อและผู้ขาย ในทุกระดับราคา
แตกต่างจากโปรไฟล์ปริมาณแบบดั้งเดิม ตัวชี้วัดนี้วิเคราะห์ เดลตาปริมาณ (ปริมาณซื้อ – ปริมาณขาย) เพื่อแสดงว่าผู้เข้าร่วมตลาดที่มีความก้าวร้าวอยู่ที่ใด
ช่วยให้นักเทรดระบุ กิจกรรมสถาบัน, โซนการดูดซับ และระดับราคาที่มีความสนใจสูง ได้อย่างแม่นยำ
คุณสมบัติหลัก
โปรไฟล์ปริมาณแบบเดลตา
ตัวชี้วัดคำนวณ เดลตาปริมาณในแต่ละระดับราคา แยก:
• แรงกดดันการซื้อที่ก้าวร้าว
• แรงกดดันการขายที่ก้าวร้าว
สิ่งนี้เปิดเผยว่า ใครเป็นผู้ควบคุมตลาดจริงๆ.
ช่วงโปรไฟล์ที่ปรับเปลี่ยนได้และปรับแต่งได้
ช่วงการคำนวณโปรไฟล์ ปรับแต่งได้อย่างเต็มที่.
ผู้ใช้สามารถกำหนดพื้นที่การคำนวณโดย:
• ช่วงแท่งเทียนที่กำหนดเอง
• ช่วงเซสชัน
• การเลือกด้วยตนเอง
• ช่วงไดนามิกแบบเลื่อน
โปรไฟล์จะ อัปเดตโดยอัตโนมัติเมื่อมีข้อมูลใหม่เข้ามา.
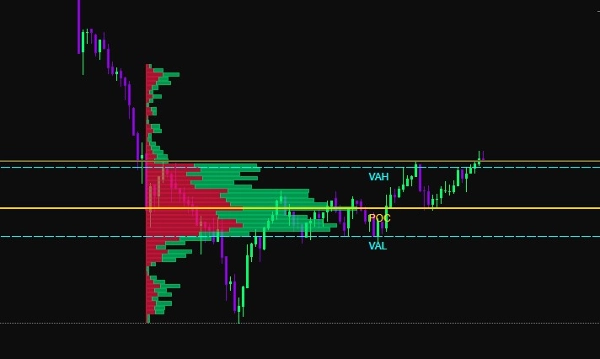
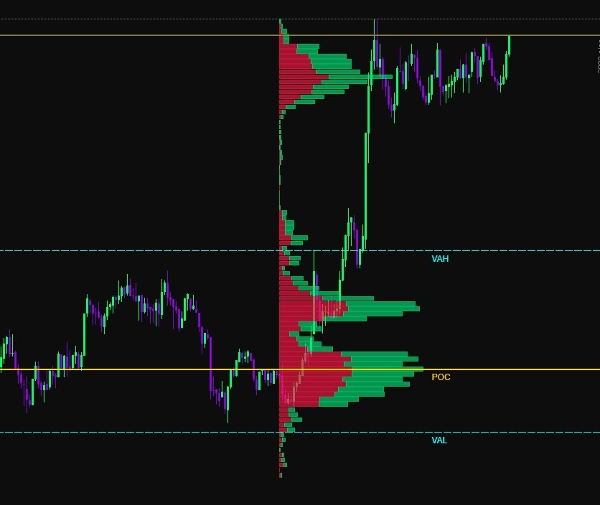
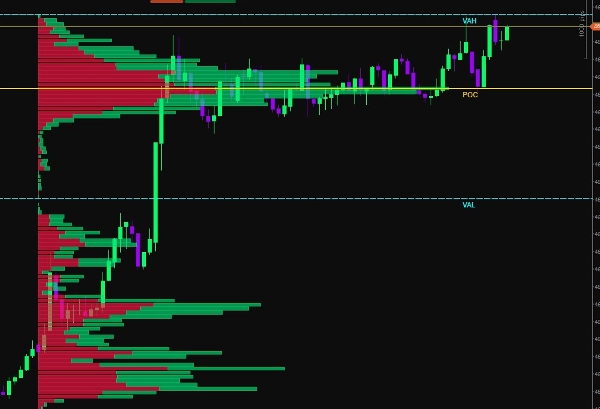
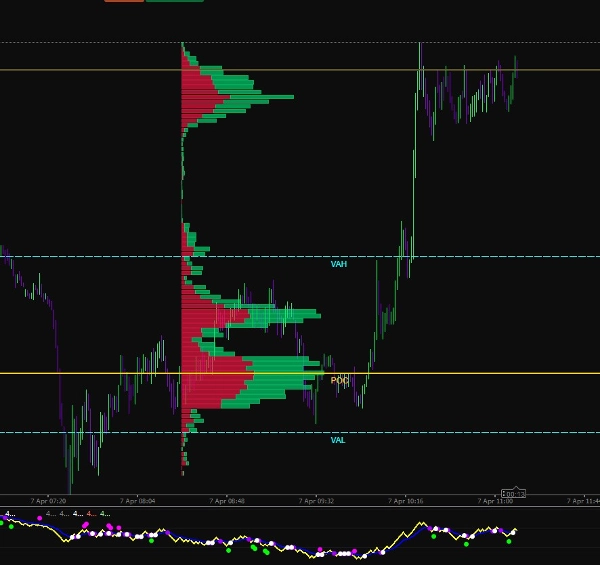
การตรวจจับพื้นที่มูลค่า
ตัวชี้วัดจะคำนวณระดับโครงสร้างตลาดสำคัญโดยอัตโนมัติ:
POC (จุดควบคุม)
ระดับราคาที่มีปริมาณเดลตาซื้อขายสูงสุด
VAH (ค่าสูงสุดของพื้นที่มูลค่า)
ขอบเขตบนของพื้นที่มูลค่า
VAL (ค่าต่ำสุดของพื้นที่มูลค่า)
ขอบเขตล่างของพื้นที่มูลค่า
ระดับเหล่านี้เน้นที่ กิจกรรมตลาดส่วนใหญ่ที่เกิดขึ้น.
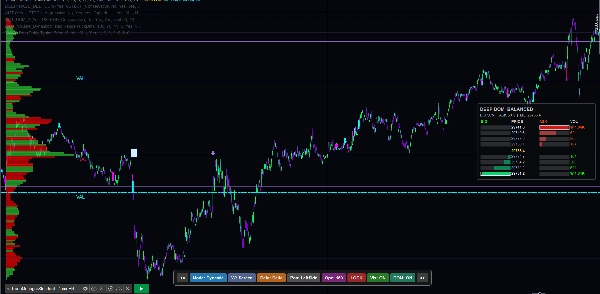
การแสดงผลการซื้อและขาย
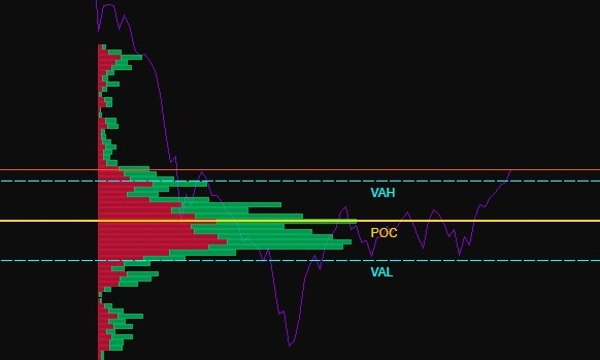
ปริมาณจะแสดงเป็น ฮิสโตแกรมแนวนอน:
แท่งสีเขียว → ปริมาณซื้อที่โดดเด่น
แท่งสีแดง → ปริมาณขายที่โดดเด่น
สิ่งนี้ช่วยให้นักเทรดเห็นได้ทันทีว่า:
• โซนการดูดซับ
• พื้นที่ความไม่สมดุล
• กลุ่มสภาพคล่อง
• รอยเท้าสถาบัน
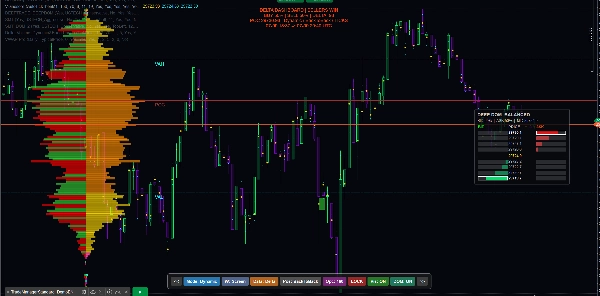
การแสดงผลที่ปรับตัวได้
ตัวชี้วัดรวมตัวเลือกการปรับแต่งภาพหลายแบบ:
• ความกว้างฮิสโตแกรมที่ปรับได้
• โทนสีที่กำหนดเอง
• ความโปร่งใสที่ปรับได้
• การควบคุมความละเอียด
• การเรนเดอร์ที่ปรับตามการซูม
สิ่งนี้รับประกันการแสดงผลที่ชัดเจนบน กรอบเวลาชาร์ททั้งหมด.
ระดับขอบเขตอัจฉริยะ
ตัวชี้วัดวาด ระดับอ้างอิงแบบไดนามิก:
• เส้น POC
• เส้น VAH
• เส้น VAL
ระดับเหล่านี้อัปเดตโดยอัตโนมัติตาม ช่วงโปรไฟล์ที่เลือก และสามารถใช้เป็น:
• แนวรับ / แนวต้าน
• โซนการกลับตัวเฉลี่ย
• ระดับยืนยันการเบรกเอาต์
การคำนวณแบบเรียลไทม์
โปรไฟล์เดลตาปริมาณคำนวณซ้ำอย่างต่อเนื่องโดยใช้ข้อมูลตลาดสด
สิ่งนี้รับประกันว่านักเทรดจะเห็น ข้อมูลการไหลของคำสั่งที่ทันสมัยอยู่เสมอ ในช่วงตลาดที่รวดเร็ว
กรณีการใช้งาน
เครื่องมือนี้เหมาะสำหรับ:
• การเก็งกำไรระยะสั้น
• การเทรดภายในวัน
• การเทรดฟิวเจอร์ส
• การวิเคราะห์การไหลของคำสั่ง
• การติดตามสภาพคล่อง
• การตรวจจับรอยเท้าสถาบัน
ข้อได้เปรียบในการเทรดหลัก
✔ ระบุแรงกดดันการซื้อและขายที่แท้จริง
✔ ตรวจจับโซนการดูดซับและการหมดแรง
✔ หาตำแหน่งระดับสภาพคล่องสูง
✔ ปรับปรุงความแม่นยำในการเข้าเทรด
✔ ยืนยันการเบรกเอาต์หรือการกลับตัว
✔ เข้าใจโครงสร้างตลาด
ข้อมูลทางเทคนิค
วิธีการคำนวณ:
เดลตาปริมาณ = ปริมาณซื้อ − ปริมาณขาย
ประเภทโปรไฟล์:
ฮิสโตแกรมระดับราคาแนวนอน
ระดับอัตโนมัติ:
POC, VAH, VAL
โหมดอัปเดต:
อัปเดตไดนามิกแบบเรียลไทม์
การตั้งค่าที่กำหนดเอง:
• ช่วงโปรไฟล์
• ความละเอียดฮิสโตแกรม
• การปรับขนาดปริมาณ
• การตั้งค่าสี
• การมองเห็นระดับ
ความเข้ากันได้ของแพลตฟอร์ม:
ปรับแต่งสำหรับ การเรนเดอร์ชาร์ทประสิทธิภาพสูง
ออกแบบมาสำหรับนักเทรดมืออาชีพ
โปรไฟล์เดลตาปริมาณถูกสร้างขึ้นสำหรับนักเทรดที่ต้องการก้าวข้ามตัวชี้วัดพื้นฐานและ เข้าใจกลไกที่แท้จริงของตลาด.
โดยการรวม การวิเคราะห์ปริมาณ, การคำนวณเดลตา, และโครงสร้างพื้นที่มูลค่า เครื่องมือนี้ให้ ภาพที่ชัดเจนของการมีส่วนร่วมในตลาดและการกระจายสภาพคล่อง.
สรุป
Users can customize the profile calculation range using options such as custom bar range, session range, manual selection, or rolling dynamic range, with real-time updates as new market data arrives. Key market structure levels—Point of Control (POC), Value Area High (VAH), and Value Area Low (VAL)—are automatically calculated and drawn as dynamic reference lines, useful for support/resistance, mean reversion, and breakout confirmation.
Additional features include adjustable histogram width, color schemes, transparency, resolution control, and zoom-adaptive rendering for clear visualization across all chart timeframes. The tool supports use cases like scalping, intraday trading, futures trading, order flow analysis, liquidity tracking, and institutional footprint detection. It is optimized for high-performance chart rendering and aims to provide traders with precise insights into market participation and liquidity distribution.