
Levels
อินดิเคเตอร์
175 ดาวน์โหลด
เวอร์ชัน 1.0, Jan 2026
Windows, Mac

คำอธิบาย
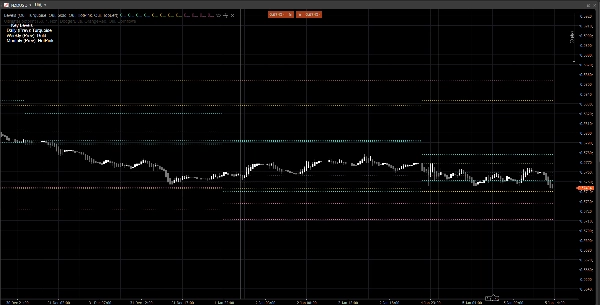
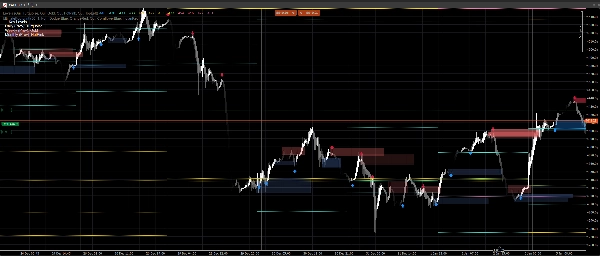
Price Action Zones เป็นตัวบ่งชี้ที่น้ำหนักเบาและไม่มีเสียงรบกวนซึ่งแสดง ระดับสำคัญรายวัน รายสัปดาห์ และรายเดือนก่อนหน้า โดยตรงบนแผนภูมิของคุณ
มันแสดง:
- วันก่อนหน้า: สูง / ต่ำ / เปิด / ปิด
- สัปดาห์ก่อนหน้า: สูง / ต่ำ / เปิด / ปิด
- เดือนก่อนหน้า: สูง / ต่ำ / เปิด / ปิด
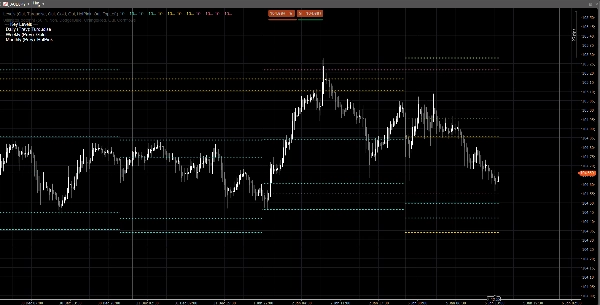
ระดับเหล่านี้ถูกใช้กันอย่างแพร่หลายเป็น โซนปฏิกิริยา, อ้างอิงสภาพคล่อง และ จุดยึดบริบท สำหรับโครงสร้างตลาด การเข้าเป้าหมาย และการวางความเสี่ยง
ทำไมมันถึงมีประโยชน์
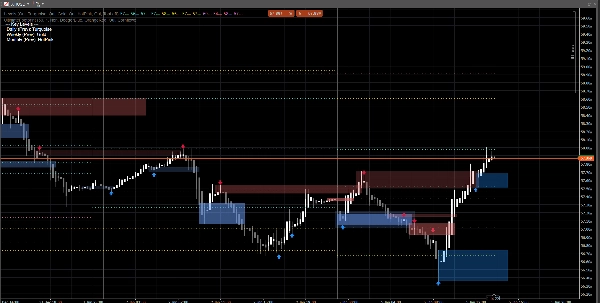
- เห็นระดับอ้างอิงช่วงเวลาที่สูงกว่าได้ทันทีโดยไม่ต้องเปลี่ยนแผนภูมิ
- ช่วยให้คุณจัดกรอบการเคลื่อนไหวราคาภายในวันรอบ PDH/PDL, PWH/PWL, PMH/PML
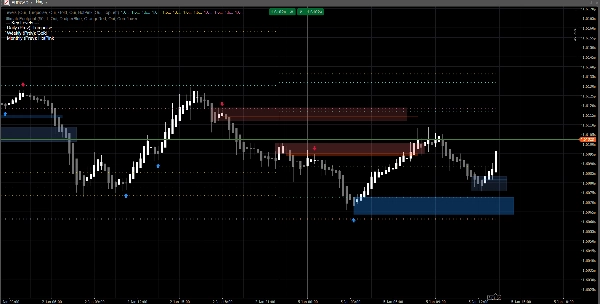
- ภาพที่สะอาด: ระดับยังคงคงที่สำหรับเซสชัน/สัปดาห์/เดือนปัจจุบัน
- ใช้งานได้กับสัญลักษณ์และช่วงเวลาทุกประเภท
การปรับแต่ง
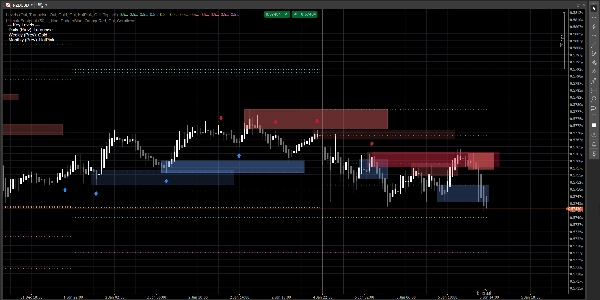
คุณสามารถเปิดปิดแต่ละช่วงเวลาได้อย่างอิสระ:
- แสดงรายวัน / รายสัปดาห์ / รายเดือน
- ตั้ง สี ที่กำหนดเองสำหรับแต่ละกลุ่ม
- เปิดใช้งาน คำอธิบายง่ายๆ พร้อมตำแหน่งมุมที่เลือกได้
หมายเหตุทางเทคนิค
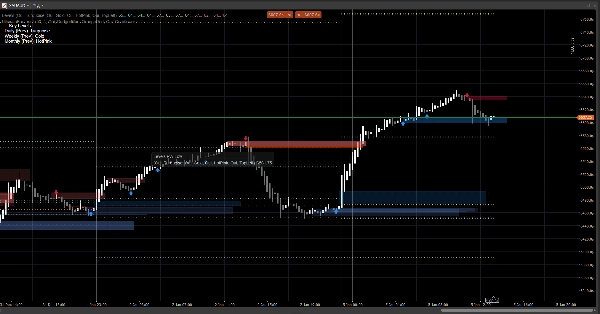
- ระดับถูกคำนวณโดยใช้ แท่งเทียนรายวัน/รายสัปดาห์/รายเดือนที่เสร็จสมบูรณ์ก่อนหน้า (ไม่ใช่แท่งที่กำลังสร้างในปัจจุบัน)
- สิ่งนี้ช่วยป้องกันการวาดซ้ำและทำให้ระดับคงที่ในระหว่างเซสชัน
ข้อจำกัดความรับผิดชอบ
ตัวบ่งชี้นี้จัดทำขึ้นเพื่อการวาดแผนภูมิและสนับสนุนการตัดสินใจเท่านั้น ไม่ได้สร้างสัญญาณซื้อ/ขายและไม่ใช่คำแนะนำทางการเงิน โปรดบริหารความเสี่ยงและตรวจสอบข้อมูลของคุณเองเสมอ
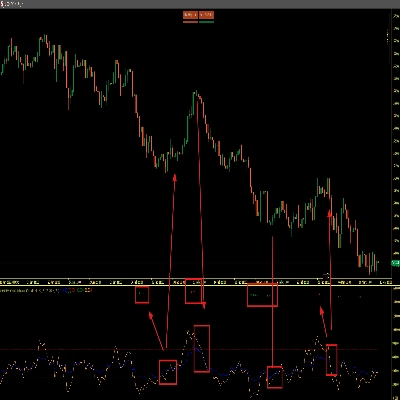
สัญญาณบนแผนภูมิถูกสร้างโดยตัวบ่งชี้ Ultimate Footprint ที่มีอยู่ในโปรไฟล์ของฉัน
สรุป
โปรไฟล์อินดิเคเตอร์
รีวิวจากลูกค้า
0.0
รีวิว: 0
รีวิวจากลูกค้า
ยังไม่มีรีวิวสำหรับผลิตภัณฑ์นี้ หากเคยลองแล้ว ขอเชิญมาเป็นคนแรกที่บอกคนอื่น!
การสนทนา
คำถามที่พบบ่อย
Prop
Forex
Indices
Commodities
Crypto
Stocks
ผลิตภัณฑ์ที่มีให้บริการผ่าน cTrader Store รวมถึงบอทการเทรด อินดิเคเตอร์ และปลั๊กอิน มีให้บริการโดยนักพัฒนาบุคคลที่สามและมีไว้เพื่อวัตถุประสงค์ในการเข้าถึงข้อมูลและทางเทคนิคเท่านั้น cTrader Store ไม่ใช่โบรกเกอร์และไม่ได้ให้คำแนะนำการลงทุน คำแนะนำส่วนบุคคล หรือการรับประกันผลการดำเนินงานในอนาคต


ราคา
ตั้งแต่ 23/07/2025
6.91M
ปริมาณการเทรด
27.63K
Pips ที่ได้กำไร
877
ติดตั้งฟรี