
คำอธิบาย
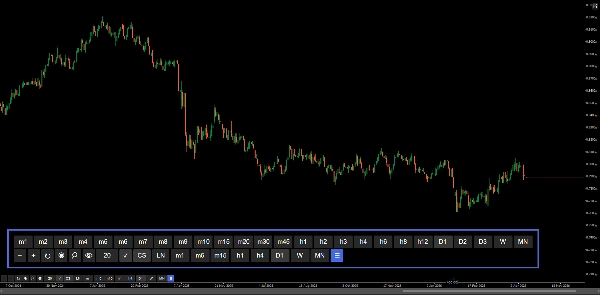
แผงควบคุมแผนภูมิสำหรับการนำทางที่รวดเร็วขึ้น — ซูม, กรอบเวลา และการตั้งค่าแผนภูมิ โดยไม่ต้องออกจากแผนภูมิ
การตั้งค่าซูมล่วงหน้า, การป้อนซูมด้วยตนเอง, ตัวเลือกกรอบเวลาและแผนภูมิแบบเต็ม, กรอบเวลาที่ชื่นชอบที่กำหนดค่าได้, ตัวคั่นช่วงเวลา, ตารางตัวเลขกลม และเส้นเสนอซื้อ/ขายสด — ทั้งหมดนี้เข้าถึงได้ผ่านปุ่ม UI บนแผนภูมิ ออกแบบมาเพื่อลดเวลาที่ใช้ในการนำทางเมนูพื้นฐานของ cTrader ในระหว่างเซสชันการซื้อขายที่ใช้งานอยู่
คุณสมบัติ
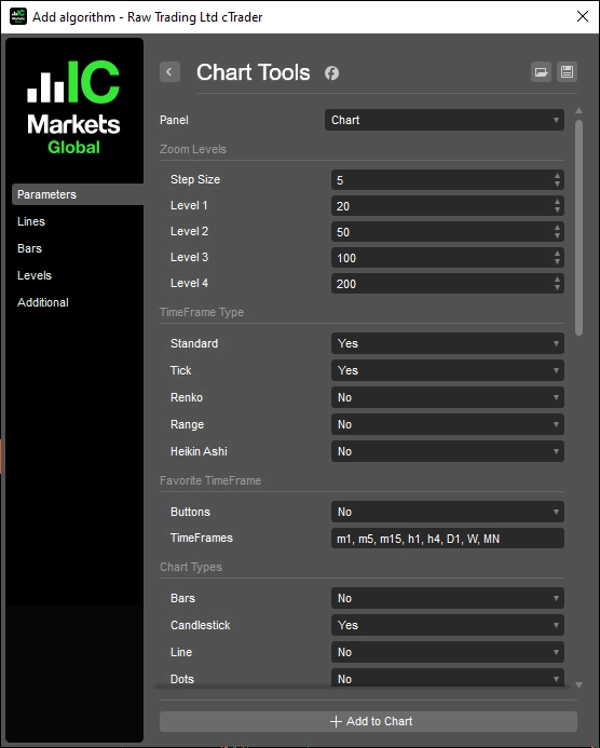
การควบคุมการซูม
- ซูมเข้า / ซูมออก พร้อมขนาดขั้นตอนที่กำหนดค่าได้
- ระดับซูมล่วงหน้าสี่ระดับที่กำหนดค่าได้สำหรับการเข้าถึงด้วยคลิกเดียว
- ป้อนซูมด้วยตนเองพร้อมปุ่มใช้
- ซิงค์กับเหตุการณ์ซูมพื้นฐานของ cTrader
ตัวเลือกกรอบเวลา
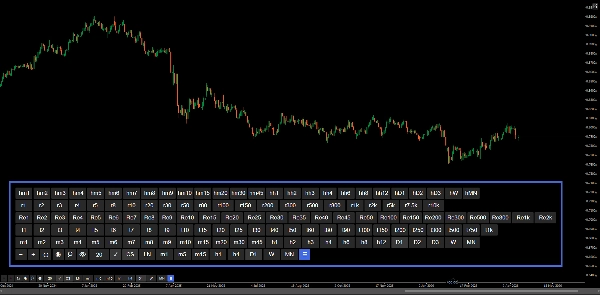
- แผงปุ่มเต็มรูปแบบครอบคลุมกรอบเวลาทุกประเภท: มาตรฐาน, Heikin Ashi, Renko, ช่วง, Tick
- โหมดทั้งหมดแสดงทุกประเภทเป็นแถวแยกต่างหาก
- กรอบเวลาที่ใช้งานถูกเน้นโดยอัตโนมัติ
- สลับการแสดงแผงด้วยปุ่ม ☰
กรอบเวลาที่ชื่นชอบ
- แถวเข้าถึงด่วนที่กำหนดค่าได้ผ่านการป้อนข้อมูลที่คั่นด้วยเครื่องหมายจุลภาค (เช่น m1, h1, D1)
- รองรับกรอบเวลาทุกประเภทรวมถึงช่วงและ Tick
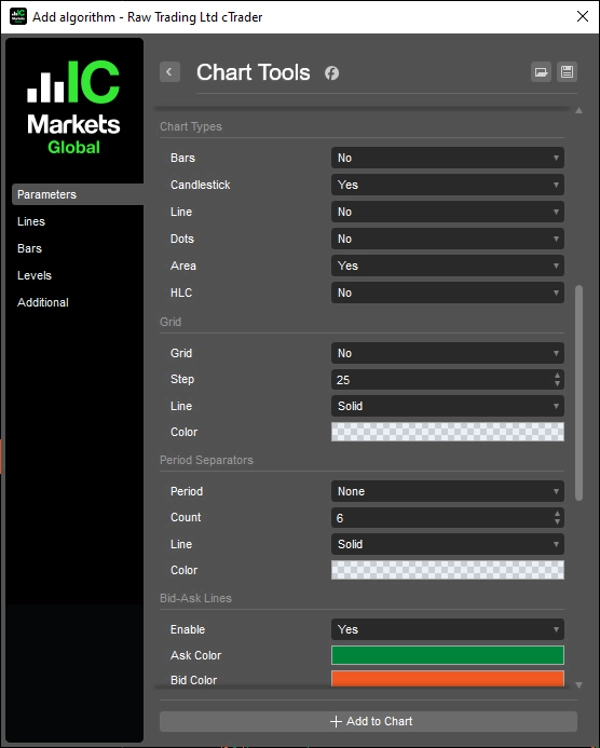
ประเภทแผนภูมิ
- ปุ่มสลับอย่างรวดเร็วสำหรับ: แท่ง, เทียน, เส้น, จุด, พื้นที่, HLC
- ประเภทแผนภูมิที่ใช้งานถูกเน้นโดยอัตโนมัติ
- แต่ละปุ่มสามารถกำหนดค่าได้แยกกันผ่านพารามิเตอร์
ตาราง
- ตารางที่อิงตัวเลขกลมพร้อมช่วง pip ที่กำหนดค่าได้ (ตัวคูณ)
- ป้ายราคาพร้อมการจัดรูปแบบทศนิยมอย่างชาญฉลาด
- เส้นขยายออกไป 10 แท่งเกินกว่าแท่งสุดท้าย
- สลับเปิด/ปิดได้
ตัวคั่นช่วงเวลา
- ตัวคั่นรายวัน, รายสัปดาห์, รายเดือน และรายปี
- จำนวน, สี, รูปแบบเส้น และความหนาที่กำหนดค่าได้
- อัปเดตอัตโนมัติเมื่อเลื่อนและซูม
เส้นเสนอซื้อ/ขาย
- เส้นเสนอซื้อและเสนอขายสดที่ขยายไปไม่สิ้นสุด
- สีที่กำหนดค่าได้สำหรับเสนอขายและเสนอซื้อ
- สลับเปิด/ปิดได้
ปุ่ม
- ตำแหน่ง: มุมบนขวา, มุมบนซ้าย, มุมล่างขวา, มุมล่างซ้าย
- ระยะขอบที่กำหนดค่าได้
- สีปุ่มและสีข้อความที่กำหนดค่าได้ — รวมถึงสถานะใช้งาน, ใช้ซูม และปุ่มสลับแผนภูมิ
__________________________________________________________________________________________
ตัวชี้วัดฟรีเพิ่มเติม
สำรวจเครื่องมือวิเคราะห์ตลาดหลากหลายประเภท — ตั้งแต่โครงสร้างและปริมาณไปจนถึงการถดถอย, ความผันผวน และกรอบเวลาที่กำหนดเอง
ซอร์สโค้ดมีให้บน GitHub ที่เก็บ.
ทั้งหมดใช้ฟรี แต่ถ้าคุณต้องการสนับสนุนด้วยกาแฟ คุณสามารถส่งได้ ที่นี่.
แนวรับ/แนวต้าน
ปริมาณ
- โปรไฟล์กิจกรรมปริมาณ
- ตัววิเคราะห์ประสิทธิภาพปริมาณ
- การวิเคราะห์โปรไฟล์ปริมาณ
- โปรไฟล์ปริมาณ - อัปเดต
- การวิเคราะห์การกระจายปริมาณ
- VWAP (ราคาเฉลี่ยถ่วงน้ำหนักด้วยปริมาณ)
ค่าเฉลี่ยเคลื่อนที่
- ช่อง SSL
- ค่าเฉลี่ยเคลื่อนที่แบบยึดจุด
- ค่าเฉลี่ยเคลื่อนที่แบบสเกลเบี่ยงเบน
- ตัวกระตุ้น Gann High Low
- เส้นแนวโน้มทันที
- Kaufman Adaptive MA พร้อม Trend Vision
- ช่องค่าเฉลี่ยเคลื่อนที่
- ชุดค่าเฉลี่ยเคลื่อนที่
- ช่องแนวโน้มค่าเฉลี่ยเคลื่อนที่
ยูทิลิตี้/กำหนดเอง
แบบถดถอย
ความผันผวน
ออสซิลเลเตอร์
__________________________________________________________________________________________
ข้อจำกัดความรับผิดชอบ
การซื้อขายมีความเสี่ยง ตัวชี้วัดนี้มีไว้สำหรับการวิเคราะห์ทางเทคนิคเท่านั้น — โปรดใช้การจัดการความเสี่ยงที่เหมาะสมและซื้อขายอย่างรับผิดชอบเสมอ
ข้อเสนอแนะ & การปรับปรุง
หากคุณมีข้อเสนอแนะ คำขอคุณสมบัติ หรือไอเดียสำหรับการปรับปรุง โปรดฝากความคิดเห็นในแท็บอภิปราย ข้อเสนอแนะของคุณช่วยปรับปรุงตัวชี้วัดสำหรับทุกคน
สรุป
Users can configure a quick-access row of favorite timeframes supporting all timeframe types. The chart type switcher offers quick buttons for Bars, Candlestick, Line, Dots, Area, and HLC charts, each with individual configuration and automatic active state highlighting.
Additional features include a round numbers-based grid with configurable pip intervals and smart decimal formatting, daily to yearly period separators with customizable appearance, and live bid/ask lines extending indefinitely with color customization and toggle options.
The control panel’s buttons can be positioned in any corner of the chart with configurable margins and colors, including active states and zoom application. This tool aims to streamline active trading sessions by reducing time spent navigating native menus, supporting efficient technical analysis on various chart types and timeframes.
รีวิวจากลูกค้า
5 | 100 % | |
4 | 0 % | |
3 | 0 % | |
2 | 0 % | |
1 | 0 % |


