
คำอธิบาย
ตัวบ่งชี้จุดสูงสุดและต่ำสุดหลัก: ภาพรวมอย่างครอบคลุม
บทนำ
ในโลกการซื้อขายที่รวดเร็ว การมีเครื่องมือที่เหมาะสมในมือสามารถสร้างความแตกต่างได้อย่างมาก ตัวบ่งชี้จุดสูงสุดและต่ำสุดหลักถูกออกแบบมาเพื่อระบุจุดเปลี่ยนสำคัญในตลาด ช่วยให้เทรดเดอร์ตัดสินใจอย่างมีข้อมูล เครื่องมือที่ทรงพลังนี้ใช้ประโยชน์จากอัลกอริทึมขั้นสูงเพื่อระบุจุดสูงสุดและต่ำสุดที่สำคัญ เพิ่มประสิทธิภาพกลยุทธ์การซื้อขายของคุณและปรับปรุงผลการดำเนินงานโดยรวม ด้วยอัตราความแม่นยำเฉลี่ยประมาณ 60% ถึง 70% ในกรอบเวลาที่ 45 นาที ตัวบ่งชี้นี้เป็นทรัพย์สินที่เชื่อถือได้สำหรับเทรดเดอร์ที่ต้องการใช้ประโยชน์จากการเคลื่อนไหวของตลาด เหมาะสำหรับทั้งเทรดเดอร์รายวันและสแคปเปอร์
คุณสมบัติหลัก
1. การแสดงผลแบบภาพ
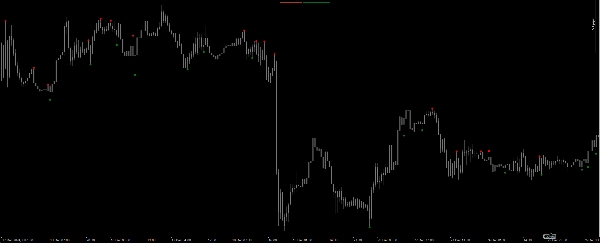
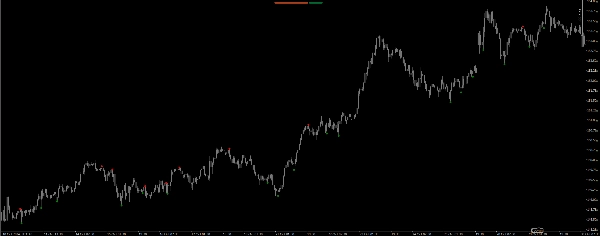
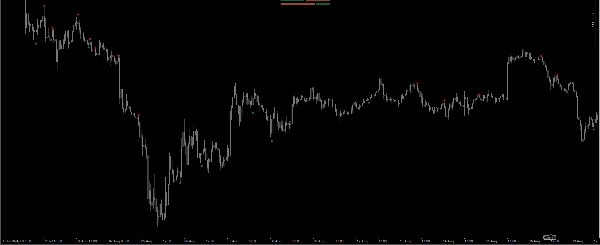
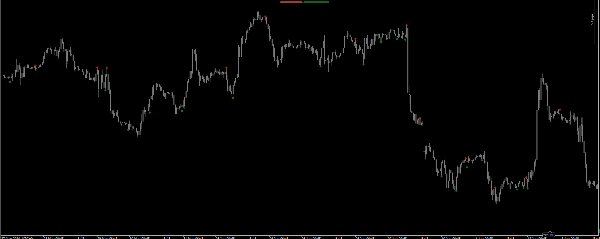
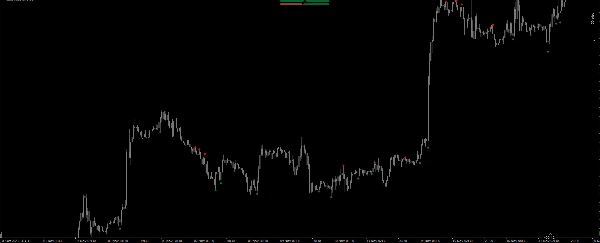
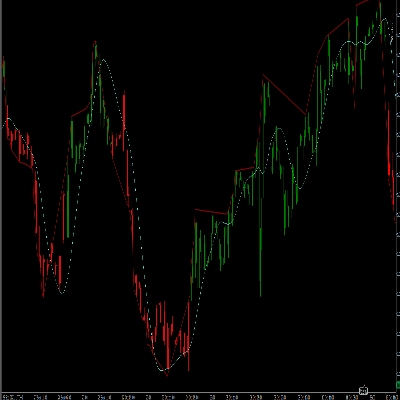
ตัวบ่งชี้จุดสูงสุดและต่ำสุดหลักให้การแสดงผลภาพที่ชัดเจนของพลวัตตลาด โดยจุดสูงสุดหลักจะถูกทำเครื่องหมายด้วยสีแดงและจุดต่ำสุดหลักด้วยสีเขียว เทรดเดอร์สามารถระบุจุดกลับตัวที่เป็นไปได้ได้อย่างรวดเร็ว การใช้จุดทำให้ระดับสำคัญเหล่านี้โดดเด่นบนกราฟ ช่วยให้มองเห็นโอกาสในการซื้อขายได้ง่ายขึ้นในทันที
2. การคำนวณที่แม่นยำ
แกนหลักของตัวบ่งชี้จุดสูงสุดและต่ำสุดหลักอยู่ที่วิธีการคำนวณ โดยการวิเคราะห์การเคลื่อนไหวของราคาของแท่งเทียนสี่แท่งล่าสุด ตัวบ่งชี้จะกำหนดว่ามีการก่อตัวของจุดสูงสุดหรือจุดต่ำสุดหลักหรือไม่ ซึ่งทำได้ผ่านการเปรียบเทียบราคาสูงสุดและต่ำสุดหลายครั้ง เพื่อให้แน่ใจว่ามีการระบุเฉพาะจุดเปลี่ยนที่สำคัญเท่านั้น
3. เทคนิคการสแคปปิ้งที่พัฒนาขึ้น
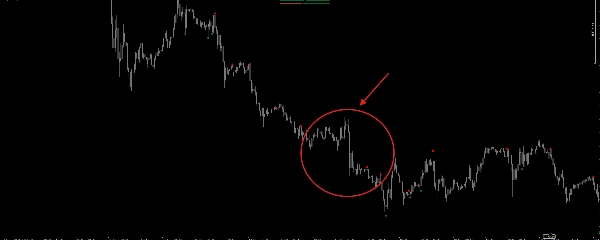
สำหรับเทรดเดอร์ที่เชี่ยวชาญด้านการสแคปปิ้ง ตัวบ่งชี้จุดสูงสุดและต่ำสุดหลักเป็นทรัพย์สินที่ประเมินค่าไม่ได้ โดยการระบุจุดเปลี่ยนสำคัญ เทรดเดอร์สามารถเข้าและออกจากตำแหน่งได้อย่างแม่นยำ ความสามารถในการมองเห็นจุดสูงสุดและต่ำสุดหลักอย่างรวดเร็วช่วยให้สามารถวางจุดทำกำไร (TP) และจุดหยุดขาดทุน (SL) อย่างเข้มงวด ลดความเสี่ยงในขณะที่เพิ่มโอกาสในการทำกำไร ด้วยความแม่นยำประมาณ 60% ถึง 70% ในกรอบเวลา 45 นาที จึงแนะนำอย่างยิ่งให้ใช้จุดหยุดขาดทุนเพื่อลดความสูญเสียที่อาจเกิดขึ้นเมื่อสัญญาณพลาด
ประโยชน์ของการใช้ตัวบ่งชี้จุดสูงสุดและต่ำสุดหลัก
1. การตัดสินใจที่ดีขึ้น
ตัวบ่งชี้จุดสูงสุดและต่ำสุดหลักช่วยให้เทรดเดอร์ตัดสินใจอย่างมีข้อมูลโดยอิงจากการวิเคราะห์ตลาดที่แม่นยำ โดยการระบุจุดสูงสุดและต่ำสุดที่สำคัญ เทรดเดอร์สามารถคาดการณ์การเคลื่อนไหวของราคาได้ดีขึ้นและปรับกลยุทธ์ตามนั้น กระบวนการตัดสินใจที่ดีขึ้นนี้ช่วยเพิ่มประสิทธิภาพการซื้อขายโดยรวม
2. ศักยภาพในการทำกำไรที่เพิ่มขึ้น
ด้วยความสามารถในการระบุจุดเปลี่ยนสำคัญ เทรดเดอร์สามารถใช้ประโยชน์จากการกลับตัวของตลาดได้อย่างมีประสิทธิภาพมากขึ้น ตัวบ่งชี้จุดสูงสุดและต่ำสุดหลักช่วยให้เทรดเดอร์เข้าและออกจากตำแหน่งในเวลาที่เหมาะสม เพิ่มศักยภาพในการทำกำไร โดยการใช้ระดับ TP และ SL ที่เข้มงวด เทรดเดอร์สามารถเพิ่มผลกำไรสูงสุดในขณะที่ลดความเสี่ยง
3. อินเทอร์เฟซที่ใช้งานง่าย
ตัวบ่งชี้จุดสูงสุดและต่ำสุดหลักถูกออกแบบโดยคำนึงถึงประสบการณ์ของผู้ใช้ การแสดงผลภาพที่ชัดเจนของจุดสูงสุดและต่ำสุดหลักช่วยให้เทรดเดอร์ตีความสัญญาณที่ตัวบ่งชี้ให้มาได้ง่าย อินเทอร์เฟซที่ใช้งานง่ายนี้ทำให้เข้าถึงได้สำหรับเทรดเดอร์ทุกระดับประสบการณ์
4. การใช้งานที่หลากหลาย
ไม่ว่าคุณจะเป็นเทรดเดอร์รายวัน เทรดเดอร์สวิง หรือสแคปเปอร์ ตัวบ่งชี้จุดสูงสุดและต่ำสุดหลักสามารถนำไปใช้กับกลยุทธ์การซื้อขายต่างๆ ได้ ความหลากหลายนี้ทำให้เป็นเครื่องมือที่มีค่าสำหรับชุดเครื่องมือของเทรดเดอร์ ช่วยให้มีความยืดหยุ่นมากขึ้นในการปรับตัวเข้ากับสภาพตลาดที่แตกต่างกัน
บทสรุป
สรุปได้ว่า ตัวบ่งชี้จุดสูงสุดและต่ำสุดหลักเป็นเครื่องมือที่ทรงพลังที่ช่วยเพิ่มกลยุทธ์การซื้อขายโดยการระบุจุดเปลี่ยนสำคัญของตลาด ด้วยการคำนวณที่แม่นยำ การแสดงผลภาพ และความเข้ากันได้กับแพลตฟอร์ม cTrader ตัวบ่งชี้นี้ช่วยให้เทรดเดอร์ตัดสินใจอย่างมีข้อมูลและใช้ประโยชน์จากการเคลื่อนไหวของตลาด ด้วยอัตราความแม่นยำประมาณ 70% จึงเป็นสิ่งสำคัญที่จะต้องใช้จุดหยุดขาดทุนเพื่อลดการสูญเสียเมื่อสัญญาณพลาด สำหรับผลลัพธ์ที่ดีที่สุด แนะนำให้ใช้ตัวบ่งชี้นี้ในกรอบเวลาที่ 45 นาที ไม่ว่าคุณจะเป็นเทรดเดอร์ที่มีประสบการณ์หรือเพิ่งเริ่มต้น ตัวบ่งชี้จุดสูงสุดและต่ำสุดหลักสามารถปรับปรุงประสิทธิภาพการซื้อขายของคุณได้อย่างมาก ยกระดับประสบการณ์การซื้อขายของคุณวันนี้ด้วยการผนวกเครื่องมือที่นวัตกรรมนี้เข้ากับกลยุทธ์ของคุณ
สรุป
รีวิวจากลูกค้า
5 | 50 % | |
4 | 50 % | |
3 | 0 % | |
2 | 0 % | |
1 | 0 % |


!["[Hamster-Coder] Pivot Points MTF" โลโก้](https://cdn.ctrader.com/image/webp/4c143e5a-309c-40e3-a578-f04d1e133ffa_31159)


