
คำอธิบาย
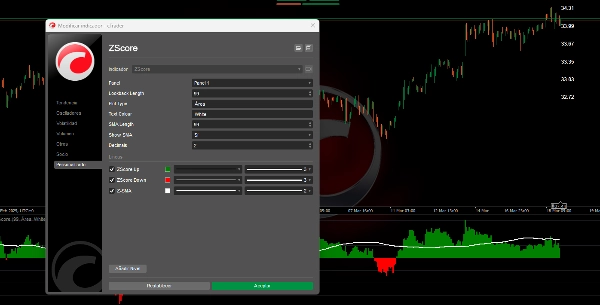
🌟 **Z-Score คืออะไร?** 🌟
• **Z-Score ในการเทรด**: เป็นวิธีการวัดว่าราคาปัจจุบันห่างจากค่าเฉลี่ยล่าสุดมากแค่ไหน โดยแสดงเป็นจำนวนส่วนเบี่ยงเบนมาตรฐาน 😊 ค่าที่ใกล้ 0 หมายความว่าราคาอยู่ใกล้ค่าเฉลี่ย ในขณะที่ค่าที่สูง (บวกหรือลบ) 😮 หมายความว่าราคามีการเบี่ยงเบนอย่างมีนัยสำคัญ
• **ประโยชน์ทางสถิติ**: ค่าพวกนี้ช่วยให้คุณระบุสถานการณ์ที่ราคาถูก "ซื้อมากเกินไป" 📈 หรือ "ขายมากเกินไป" 📉 ซึ่งมีประโยชน์สำหรับกลยุทธ์การกลับสู่ค่าเฉลี่ย หรือการตรวจจับช่วงเวลาที่มีความผันผวนสูง 💥
🌟 **ตัวชี้วัดทำงานอย่างไร** 🌟
1. **การคำนวณค่าเฉลี่ยและส่วนเบี่ยงเบน**:
- วิเคราะห์จำนวนแท่งก่อนหน้าที่กำหนด (หรือช่วงเวลา) เพื่อคำนวณราคาปิดเฉลี่ยและส่วนเบี่ยงเบนมาตรฐาน 🧮
- ด้วยค่าพวกนี้ จะกำหนดได้ว่าราคาปัจจุบันเบี่ยงเบนจากค่าเฉลี่ยมากแค่ไหน ความแตกต่างนี้แสดงเป็น Z-Score
2. **การแสดงผลของ Z-Score**:
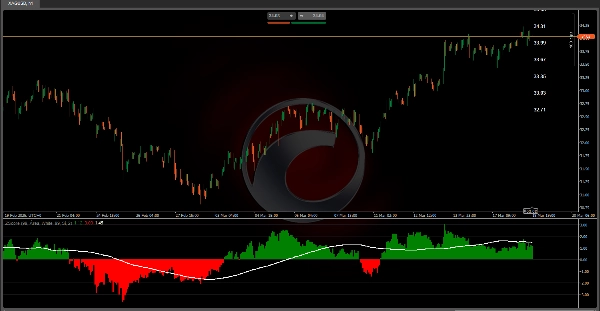
- **โหมดพื้นที่**: แสดงฮิสโตแกรมสองอัน: สีเขียว 🟩 สำหรับค่าบวก (เมื่อราคาสูงกว่าค่าเฉลี่ย) และสีแดง 🔴 สำหรับค่าลบ (เมื่อราคาต่ำกว่า) ซึ่งช่วยให้คุณเห็นขนาดและทิศทางของการเบี่ยงเบนได้อย่างชัดเจน
3. **ค่าเฉลี่ยเคลื่อนที่ของ Z-Score**:
- คำนวณค่าเฉลี่ยเคลื่อนที่ของค่า Z-Score ช่วยให้ลดความผันผวนและระบุแนวโน้มของการเบี่ยงเบนราคาตามเวลา 📊
4. **โซนความน่าจะเป็นและป้ายอ้างอิง**:
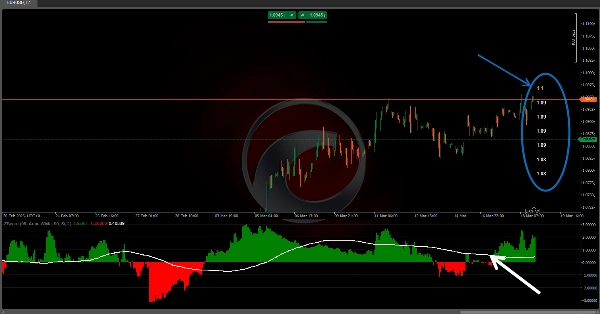
- นอกจากนี้ ยังมีการวางป้ายบนกราฟแสดงราคาที่สอดคล้องกับค่าเฉลี่ยและแต่ละระดับของการเบี่ยงเบน ซึ่งช่วยให้เข้าใจได้ว่าตลาดกำลังแสดงพฤติกรรม "สุดขีด" แค่ไหน ⚠️
---
🌟 **การตีความและการประยุกต์ใช้สำหรับนักเทรด** 🌟
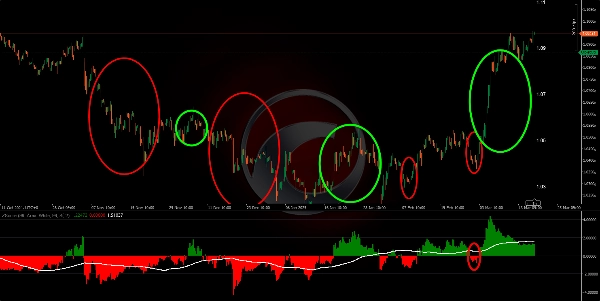
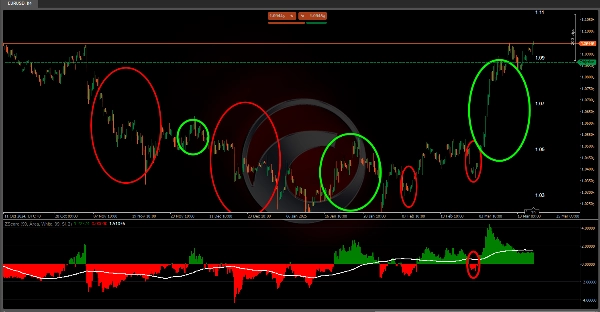
• **การตรวจจับความสุดขีด**: โดยการสังเกตค่าที่สูงหรือต่ำมากในตัวชี้วัด นักเทรดสามารถระบุได้ว่าราคามีการเคลื่อนที่ออกจากค่าเฉลี่ยอย่างมีนัยสำคัญ ซึ่งอาจบ่งชี้ว่าการปรับฐานอาจเกิดขึ้น (ถ้าคาดหวังการกลับสู่ค่าเฉลี่ย) 🔄 หรือว่ากำลังเกิดการเบรกเอาท์ที่แข็งแกร่ง
• **การยืนยันแนวโน้ม**: ค่าเฉลี่ยเคลื่อนที่ของ Z-Score และแถบที่เกี่ยวข้องช่วยให้เห็นการเปลี่ยนแปลงของแนวโน้มพฤติกรรมราคาที่สัมพันธ์กับค่าเฉลี่ย การตัดกันหรือการเปลี่ยนแปลงของเส้นเหล่านี้สามารถตีความเป็นสัญญาณเข้า 🛡️ หรือออกได้
• **การจัดการความเสี่ยง**: โดยการรู้ระดับของการเบี่ยงเบนและโซนความน่าจะเป็น คุณสามารถปรับขนาดตำแหน่งหรือกำหนดจุดหยุดขาดทุน ⬇️ และทำกำไร ⬆️ ได้ เนื่องจากมีข้อมูลอ้างอิงสำหรับการเคลื่อนไหวปกติเทียบกับความสุดขีด
• **ความเข้าใจทางสถิติของตลาด**: นอกจากจะเป็นเครื่องมือกราฟิกแล้ว ตัวชี้วัดนี้ยังส่งเสริมให้คิดเกี่ยวกับพฤติกรรมตลาดในแง่ของความน่าจะเป็น การรู้ถึง "ความปกติ" ของการเคลื่อนไหวสามารถเป็นปัจจัยตัดสินใจเมื่อประเมินโอกาสในการเทรด 🎯
🌟 **บทสรุป** 🌟
อัลกอริทึมนี้แปลงข้อมูลราคาเป็นการแสดงผลทางสถิติที่ช่วยให้เห็นภาพและวัดการเบี่ยงเบนของราคาที่สัมพันธ์กับพฤติกรรมล่าสุด โดยการรวม Z-Score, ค่าเฉลี่ยเคลื่อนที่, แถบเบี่ยงเบน และตารางความน่าจะเป็น ตัวชี้วัดนี้ให้ข้อมูลหลายชั้น ซึ่งมีคุณค่าอย่างยิ่งสำหรับการระบุช่วงเวลาที่ตลาดอยู่ในสภาวะผิดปกติ ช่วยอำนวยความสะดวกในการเข้า 🚀 ออก 🛑 และการตัดสินใจจัดการความเสี่ยงโดยอิงจากความน่าจะเป็นและสถิติ 📈📉
ตัวชี้วัดจาก Ctrader Store:
Dynamic Market Structure
Analysis of Turning Points
Fibonacci Linear
Regression Multi-timeframe
Multi-Level Candle Bias
Tracker
Auto Support and
Resistance Trend Lines
สรุป
รีวิวจากลูกค้า
5 | 100 % | |
4 | 0 % | |
3 | 0 % | |
2 | 0 % | |
1 | 0 % |


