
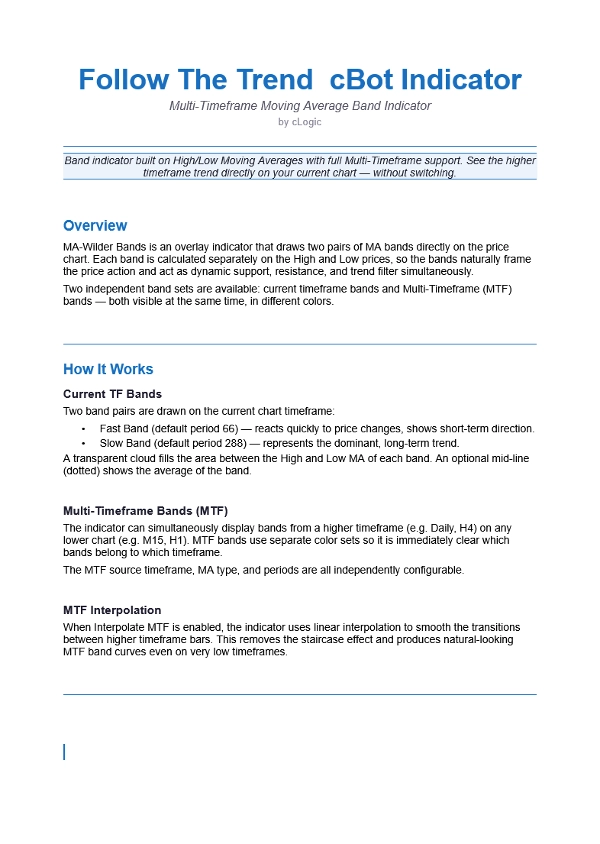
Açıklama
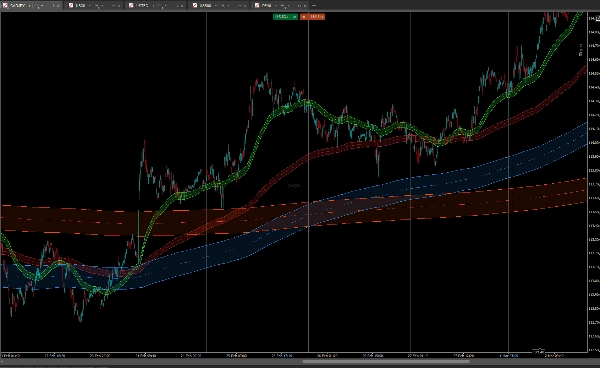
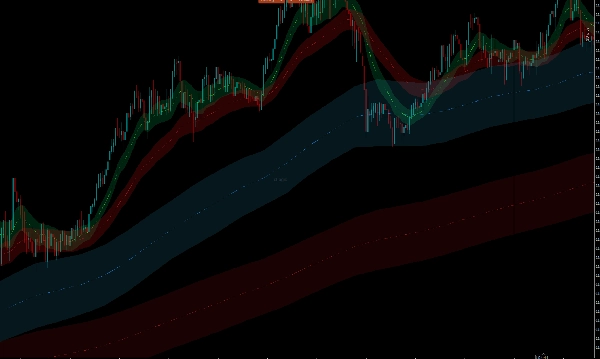
Trend'i Takip Et, Yüksek ve Düşük fiyatlar üzerinde iki çift Hareketli Ortalama bandı çizen bir üst üste binen göstergedir — Hızlı Bant ve Yavaş Bant — fiyat hareketini doğal olarak çerçeveleyen dinamik destek ve direnç bölgeleri oluşturur.
Çoklu Zaman Dilimi desteği, bantları mevcut grafiğinizde doğrudan daha yüksek bir zaman diliminden (örneğin Günlük, H4) görüntülemenizi sağlar, geçiş yapmadan. MTF bantları ayrı renkler kullanır, böylece her iki zaman dilimi de her zaman bir bakışta görünür.
Lineer enterpolasyondaha yüksek zaman dilimi çubukları arasındaki geçişleri yumuşatır, daha düşük zaman dilimlerinde merdiven etkisini ortadan kaldırır.
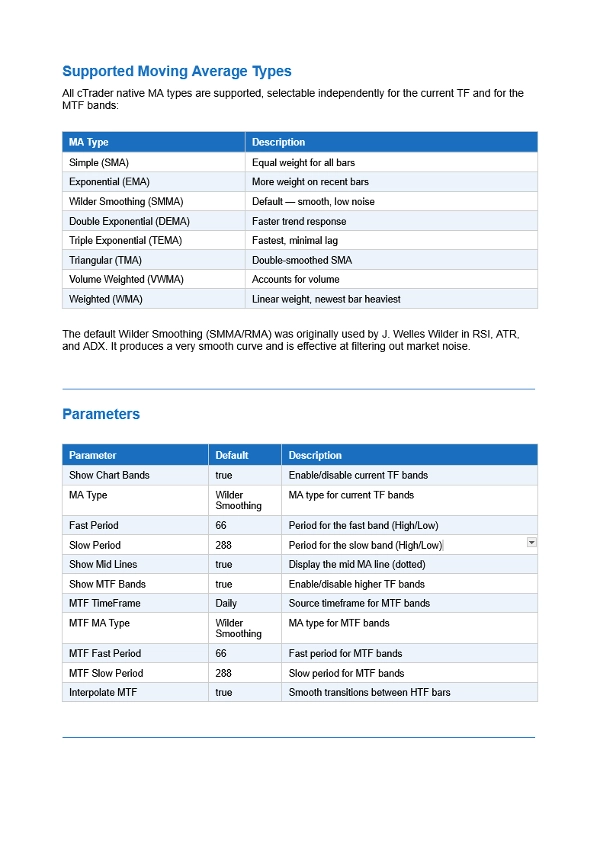
Tüm 8 cTrader MA türü desteklenir — Basit, Üssel, Wilder Düzeltme, Çift Üssel, Üçlü Üssel, Üçgen, Hacim Ağırlıklı ve Ağırlıklı — mevcut TF ve MTF bantları için bağımsız olarak seçilebilir.
Nasıl okunur:
- Fiyat her iki bandın üzerinde → yükseliş trendi
- Fiyat her iki bandın altında → düşüş trendi
- Fiyat bantların içinde → konsolidasyon
- Hızlı ve Yavaş bant arasındaki artan boşluk → trend hızlanması
Bu cBot robotunu burada bulabilirsiniz:
https://ctrader.com/products/3618?u=cLogic


