Description
HCCC MTF - Canal Composite du Cycle de Hurst (100% GRATUIT)
Présentation
Le HCCC MTF (Canal Composite du Cycle de Hurst) est un tableau de bord et un indicateur de canal Multi-Temps (MTF) avancé et entièrement interactif. Basé sur les théories cycliques de J.M. Hurst combinées à la volatilité ATR, cet outil vous aide à identifier la véritable tendance du marché et les points de retournement cycliques parfaits (pics et creux) sur plusieurs périodes simultanément.
Le second dédié au trading semi-automatique avec https://ctrader.com/products/3618?u=cLogic
IMPORTANT : Cet indicateur est entièrement 100% GRATUIT pour tout le monde. Il a été spécialement développé comme compagnon visuel ultime pour le cBot "Follow The Trend XAU Edition".
Bien que vous puissiez l'utiliser parfaitement pour le trading manuel, sa véritable puissance se révèle lorsqu'il est utilisé dans une configuration semi-automatisée : vous utilisez le tableau de bord HCCC pour lire le cycle et le momentum des périodes supérieures, puis vous activez le cBot Follow The Trend XAU Edition pour exécuter et gérer précisément les trades dans cette direction.
Caractéristiques principales
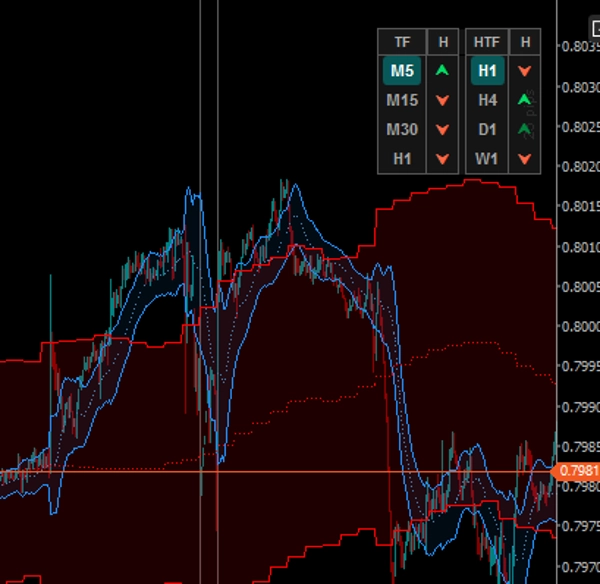
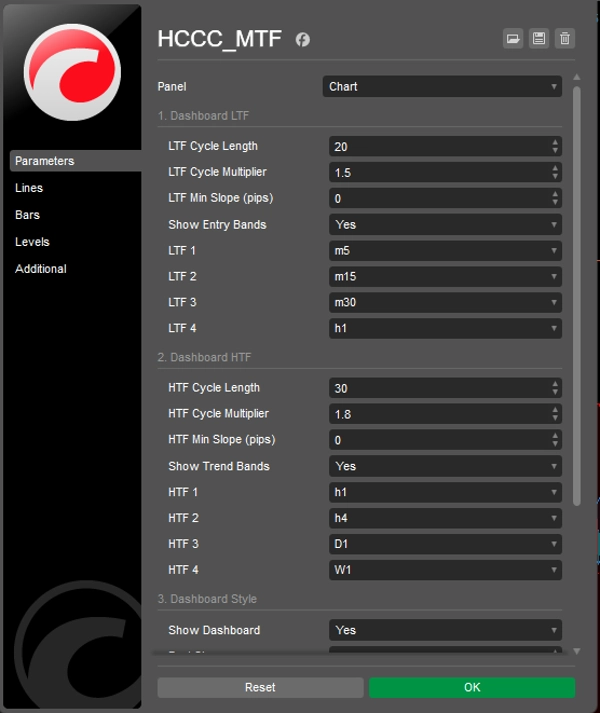
1. Tableau de bord MTF interactif (cliquable)
Oubliez de passer d'un graphique à l'autre. Le tableau de bord intégré suit 4 périodes inférieures (LTF) et 4 périodes supérieures (HTF).
- Boutons LTF : Cliquez sur n'importe quel bouton LTF pour changer instantanément la période de votre graphique actuel.
- Boutons HTF : Cliquez sur n'importe quel bouton HTF pour projeter instantanément le canal de cette période supérieure directement sur votre graphique actuel !
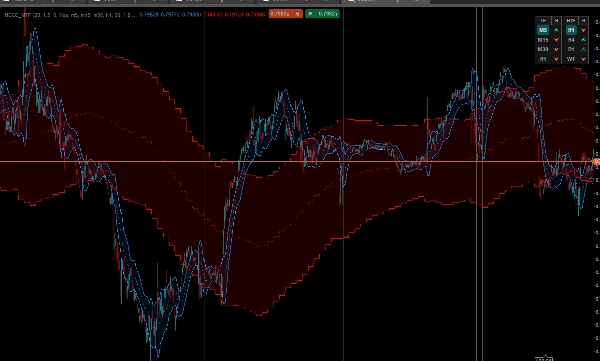
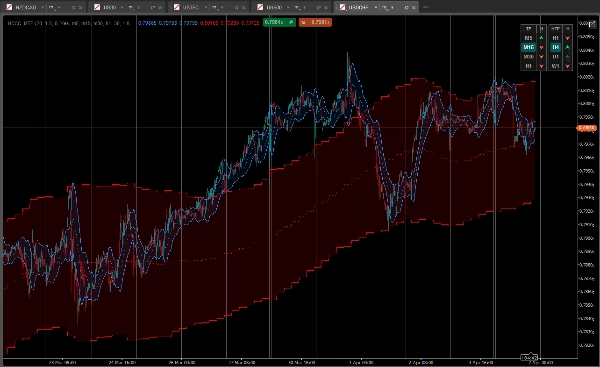
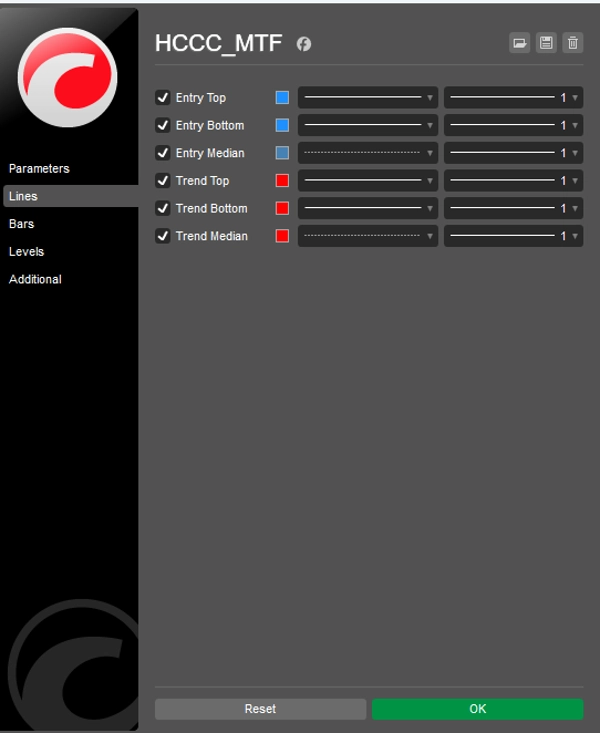
2. Système de superposition double de canaux
L'indicateur trace deux canaux élégants remplis de nuages sur votre graphique en même temps :
- Cycle d'entrée (Nuage bleu) : Calcule le cycle de Hurst basé sur la période de votre graphique actuel.
- Cycle de tendance (Nuage rouge) : Un canal à vue macro calculé à partir de la période supérieure que vous avez sélectionnée dans le tableau de bord.
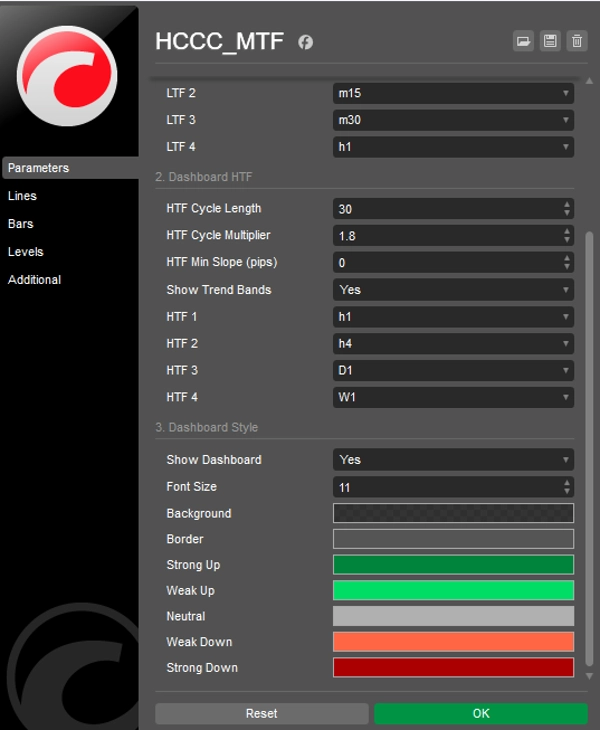
3. Signaux cycliques avancés à 5 états
Le tableau de bord ne montre pas seulement la direction de la tendance ; il affiche la phase du cycle en analysant la pente de la ligne médiane et la position du prix par rapport aux bandes ATR.
- [ ⮝ ] Vert foncé (Achat fort) : La pente médiane est HAUSSIÈRE, et le prix est tombé sur la bande inférieure. C'est un creux cyclique (acheter la baisse).
- [ ⮝ ] Vert clair (Achat faible) : La tendance est HAUSSIÈRE, mais le prix oscille autour de la médiane ou de la bande supérieure.
- [ — ] Gris (Neutre) : Le cycle est plat. Pas de momentum clair.
- [ ⮟ ] Rouge clair (Vente faible) : La tendance est BAISSIÈRE, mais le prix est proche de la médiane.
- [ ⮟ ] Rouge foncé (Vente forte) : La pente médiane est BAISSIÈRE, et le prix a remonté jusqu'à la bande supérieure. C'est un pic cyclique (vendre la hausse).
Comment l'utiliser avec le cBot "Follow The Trend XAU Edition" ?
- Regardez le côté droit du tableau de bord (colonne HTF). Attendez un alignement clair sur les périodes supérieures (par exemple, H4 et D1 affichant des flèches vert foncé/clair).
- Regardez le côté gauche du tableau de bord (colonne LTF) pour trouver un repli localisé (par exemple, M15 affichant une flèche "Achat fort" vert foncé).
- Une fois la logique MTF alignée, activez votre cBot Follow The Trend XAU Edition dans la direction "ACHAT" et laissez ses algorithmes gérer l'entrée, les stops suiveurs et la gestion des risques.
Personnalisation
Tout est entièrement personnalisable : longueurs des cycles, multiplicateurs ATR, sensibilité minimale de la pente (en pips) pour filtrer le bruit, et contrôle total sur les couleurs et le positionnement de l'interface utilisateur.
Téléchargez-le maintenant GRATUITEMENT et faites passer votre trading semi-automatisé au niveau supérieur !
Résumé
It overlays two cloud-filled channels: a blue "Entry Cycle" channel based on the current timeframe and a red "Trend Cycle" channel derived from a selected higher timeframe. The dashboard provides advanced five-state cyclic signals indicating strong or weak buy/sell conditions and neutral phases by analyzing the slope of the median line and price position relative to ATR bands.
The indicator is fully customizable, including cycle lengths, ATR multipliers, slope sensitivity, and UI appearance. It is intended to complement the "Follow The Trend XAU Edition" cBot by providing visual cycle and momentum analysis to guide semi-automated trade execution and management. The HCCC MTF supports various markets including Forex, commodities, indices, stocks, and cryptocurrencies.