
Descrição
O que é um indicador “Initial Range”?
Este indicador é uma adaptação de uma ferramenta Pine Script chamada “Opening Range Breakout”.
Originalmente, era chamado ORB – Opening Range Breakout: você pega a faixa de preço dos primeiros minutos de uma sessão e então negocia o breakout dessa faixa.
Nesta versão, renomeamos para IR – Initial Range, mas a ideia é a mesma:
- O indicador constrói várias Initial Ranges:
-
- IR5 – primeiros 5 minutos
- IR15 – primeiros 15 minutos
- IR30 – primeiros 30 minutos
- IR60 – primeiros 60 minutos
- Para cada IR você tem:
-
- IR High
- IR Low
- IR Mid (o ponto médio da faixa)
- Você pode escolher quais faixas estão ativas e quais cores elas usam.
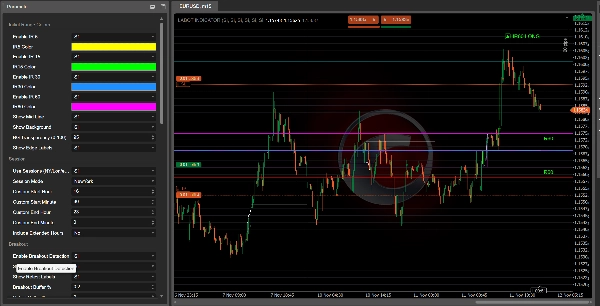
Uma vez que uma faixa está completa, o indicador procura por rompimento de preço fora dela:
- Rompimento acima do IR High → IR60 LONG, IR30 LONG, etc.
- Rompimento abaixo do IR Low → IR60 SHORT, IR30 SHORT, etc.
Estas etiquetas aparecem no gráfico para que você possa ver rapidamente qual faixa inicial produziu o sinal.
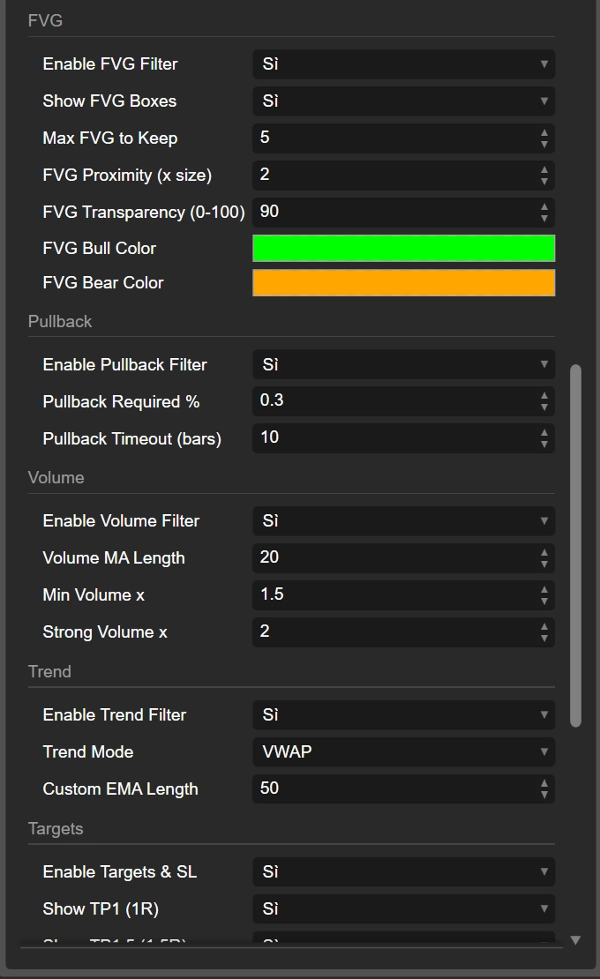
Filtros e confirmações
O indicador foi projetado para evitar rompimentos aleatórios combinando vários filtros:
- Filtro de tendência
Você pode usar: -
- VWAP
- EMA
- Comprimento personalizado da EMA
- VWAP + EMA juntos
Rompimentos na direção da tendência são favorecidos (por exemplo, LONG apenas quando o preço está acima do VWAP/EMA).
- Filtro de volume
O indicador compara o volume atual com uma média móvel de volume: -
- confirmação “normal”
- volume “forte”
Rompimentos com volume fraco podem ser ignorados se desejar.
- Filtro FVG (Fair Value Gap)
Detecta FVGs de alta e baixa e pode exigir que o rompimento ocorra próximo a um FVG relevante: -
- FVG de alta próximo ao IR High apoia LONG
- FVG de baixa próximo ao IR Low apoia SHORT
- Filtro de pullback
Você pode exigir um pullback mínimo após o rompimento e uma janela de tempo (em barras) para que esse pullback ocorra. Isso ajuda a focar em rompimentos que realmente “respiram” antes de continuar.
Rompimentos, retestes e rompimentos falhos
Após um rompimento da Initial Range, o indicador acompanha o que o preço faz em seguida:
- Conta quantas barras permanecem fora da faixa.
- Verifica se o preço se move distante o suficiente (distância mínima em %).
- Depois observa um reteste de volta para a faixa.
Você pode ver:
- IR60 LONG / IR60 SHORT (rompimento)
- Retest LONG / Retest SHORT etiquetas quando o preço retorna após um movimento sólido
- Failed LONG / Failed SHORT etiquetas quando um rompimento falha rapidamente e o preço reentra na faixa sem compromisso.
Isso lhe dá três tipos de informação:
- rompimento limpo
- rompimento saudável com reteste
- rompimento falso/falhado
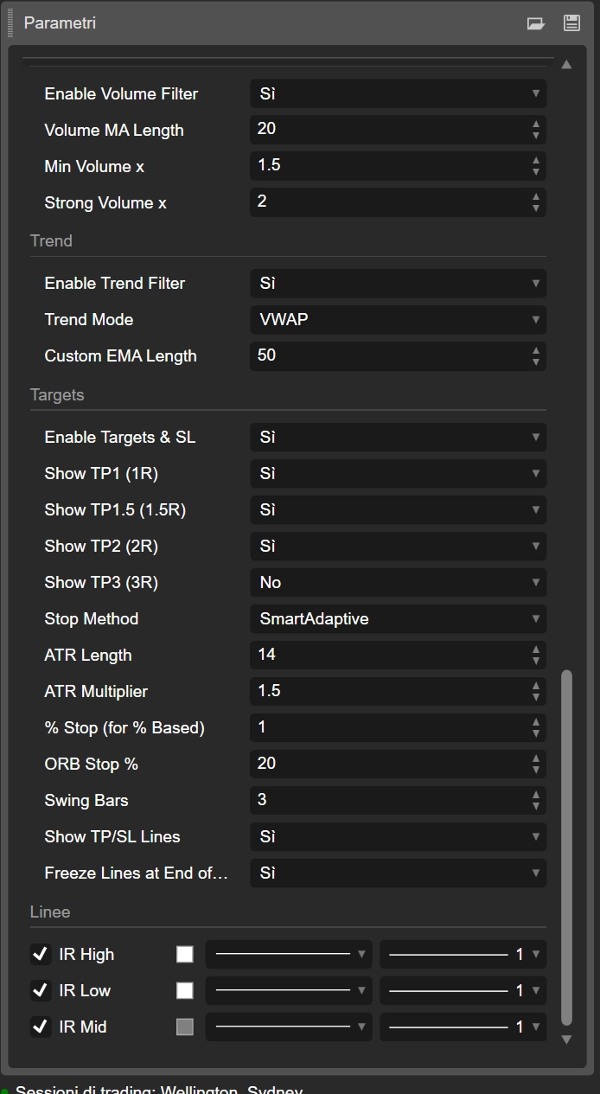
Alvos, stop loss e visualização de trades
O indicador também calcula níveis automáticos de TP e SL baseados em:
- ATR
- % da largura do IR
- stops fixos em %
- pontos de swing
- modos ATR “inteligentes”, adaptativos e escalonados
A partir do preço de entrada e do nível de stop, calcula vários alvos:
- TP1 (1R)
- TP1.5 (1.5R)
- TP2 (2R)
- TP3 (3R)
Você pode escolher quais alvos mostrar.
Linhas são desenhadas no gráfico:
- IR_ENTRY_LONG / IR_ENTRY_SHORT
- IR_SL_LONG / IR_SL_SHORT
- IR_TP1 / IR_TP1.5 / IR_TP2 / IR_TP3
Quando o preço atinge um alvo ou stop, o estado é atualizado e as linhas podem ser “congeladas” após o último TP ou no final do dia, dependendo das suas configurações.
Resumindo
- Nome antigo: ORB (Opening Range Breakout)
- Nome novo: IR (Initial Range) – mesmo conceito, nomeação mais limpa
- Constrói faixas do início da sessão (IR5, IR15, IR30, IR60)
- Marca rompimentos LONG / SHORT, retests, e rompimentos falhos
- Usa filtros de tendência, volume, FVG e pullback para melhorar a qualidade
- Desenha entrada, stop e múltiplos alvos diretamente no gráfico
Então, quando você vê “IR60 LONG” no gráfico, você está basicamente olhando para um Opening Range Breakout nos primeiros 60 minutos da sessão – só que com um nome mais moderno, personalizável e muita lógica extra por trás.
Resumo
The indicator marks breakout signals when price moves above the range high (LONG) or below the range low (SHORT), displaying corresponding labels on the chart. It also tracks retests and failed breakouts, distinguishing clean breakouts, healthy retests, and fake moves.
To improve signal quality, the indicator incorporates multiple filters: trend filters using VWAP and EMA, volume filters comparing current volume to averages, Fair Value Gap (FVG) filters detecting bullish or bearish imbalances near breakout levels, and pullback filters requiring minimum retracements after breakouts.
Additionally, it calculates and plots automatic entry, stop loss, and multiple take profit levels based on ATR, percentage of the initial range width, fixed percentages, swing points, and adaptive ATR modes. These visual aids help traders manage risk and targets directly on the chart.
The Initial Range indicator supports various markets including Forex, stocks, indices, commodities, and cryptocurrencies, and is designed to enhance breakout trading strategies with customizable parameters and comprehensive trade visualization.
Avaliações de clientes
5 | 100 % | |
4 | 0 % | |
3 | 0 % | |
2 | 0 % | |
1 | 0 % |


