
Descrição
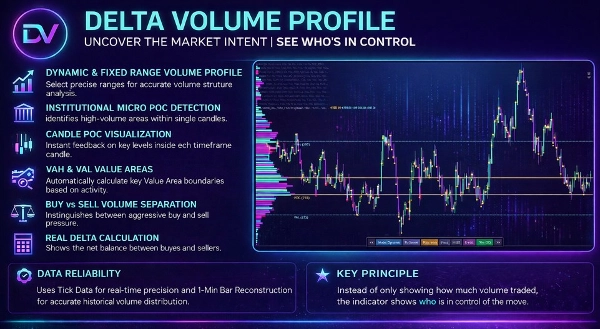
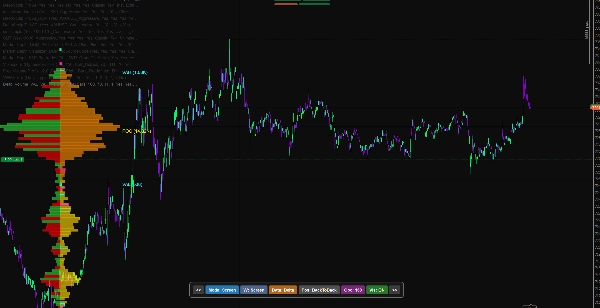
Perfil de Volume Avançado Pro: Intervalo Fixo Institucional & Fluxo de Ordens
Melhore sua análise de mercado com o Perfil de Volume Avançado Pro, um indicador altamente otimizado, de nível institucional, projetado para traders. Desenvolvido para day traders, scalpers e swing traders que dependem da Teoria do Mercado de Leilão, esta ferramenta traz precisão à Distribuição de Volume, Áreas de Valor e dinâmicas de Fluxo de Ordens.
Ao contrário dos perfis de volume padrão para varejo que recalculam, deslocam ou quebram constantemente quando você dá zoom in e out, este indicador introduz um Modo de Âncora Verdadeira (Intervalo Fixo) com retenção de memória, tornando-o a ferramenta definitiva para trading ao vivo e backtesting histórico rigoroso.
🔥 Recursos Principais & Vantagem de Trading
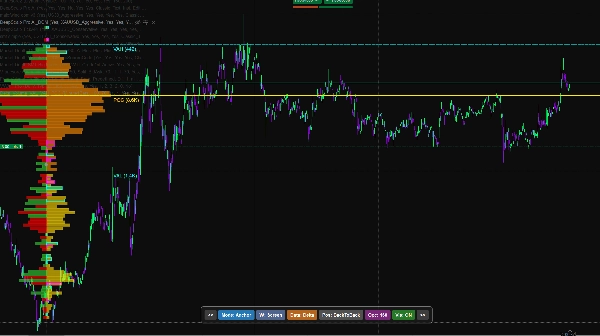
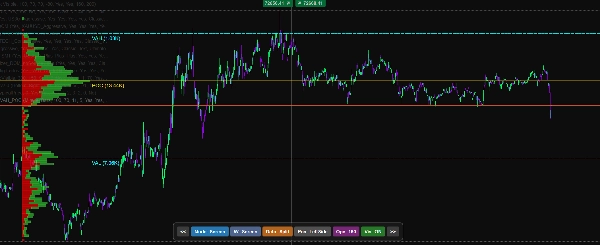
1. Modo de Âncora Verdadeira (Perfeito para backtesting)
Pare de lutar com perfis que se deslocam! Com nosso Modo de Âncora, você pode colocar duas linhas verticais interativas em qualquer lugar do seu gráfico para analisar um swing específico, sessão ou zona de consolidação.
- Zero Distorção: Dê zoom in, zoom out ou role — o perfil permanece matematicamente fixo aos pontos de âncora escolhidos.
- Backtesting histórico: Role meses ou anos no tempo, ancore o perfil a um evento de mercado passado e analise a distribuição exata de volume e o Ponto de Controle (POC) como aconteceu. As âncoras lembram suas posições exatas, permitindo estudar setups passados perfeitamente sem que a grade seja reiniciada.
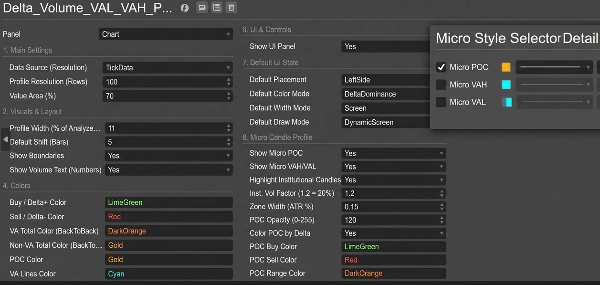
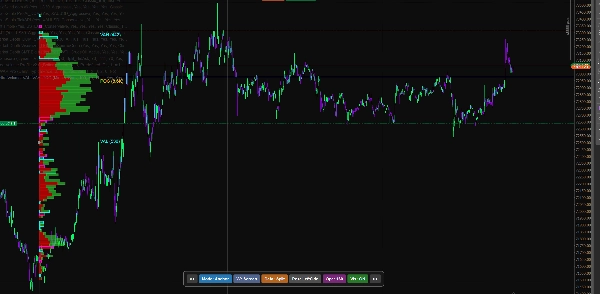
2. Painel de UI Interativo no Gráfico
Não é necessário abrir constantemente as configurações do indicador. Um painel de UI elegante e não intrusivo na parte inferior do seu gráfico permite que você:
- Alterne entre Modo Tela (Dinâmico) e Modo Âncora (Intervalo Fixo) com um clique.
- Desloque a posição do perfil (Esquerda, Direita, Costas a Costas).
- Ajuste a Largura Visual e a Opacidade em tempo real.
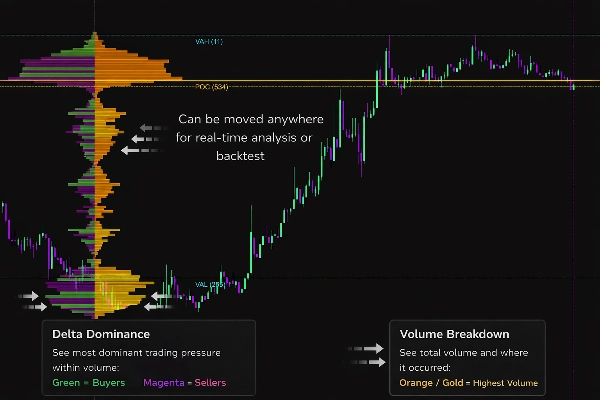
- Alterne entre Divisão Compra/Venda e Dominância Delta na coloração do volume.
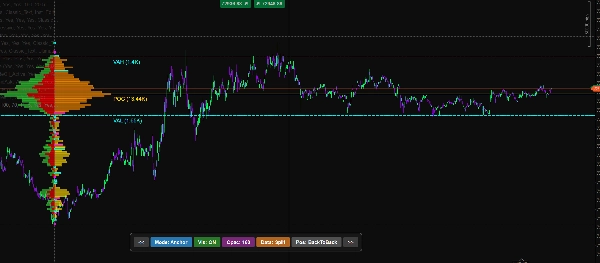
3. Insights Profundos do Fluxo de Ordens
Leia a microestrutura do mercado como um profissional:
- Dominância & Divisão Delta: Visualize a compra agressiva do mercado versus a venda do mercado dentro de cada nó de preço.
- Desequilíbrios de Volume: Detecte e destaque automaticamente desequilíbrios massivos de compra/venda (razão personalizável, por exemplo, 300% de dominância) para identificar absorção institucional ou rompimentos agressivos.
- Detecção HVN & LVN: Identifica claramente Nós de Alto Volume (ímãs para o preço) e Nós de Baixo Volume (vazios de liquidez onde o preço se move rapidamente).
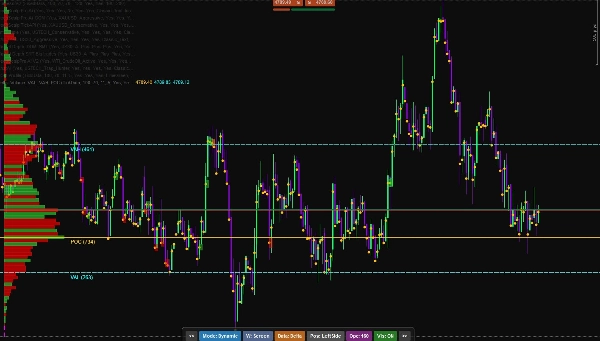
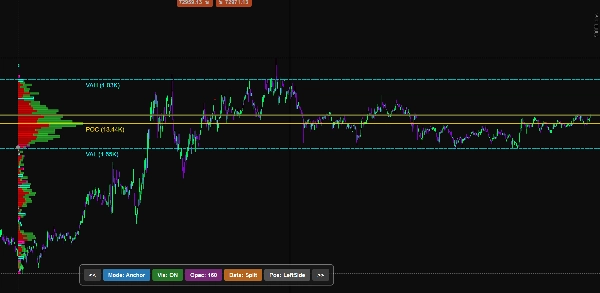
4. Área de Valor Dinâmica & POC Nu
- Exibe com precisão Alta da Área de Valor (VAH) e Baixa da Área de Valor (VAL) baseadas em desvios padrão (padrão 70%).
- Destaca o Ponto de Controle (POC).
- Estenda o POC Nu: Estende automaticamente as linhas de POC não verificadas para o futuro, fornecendo alvos de suporte e resistência altamente reativos.
5. Altamente Otimizado
- Fontes de Dados: Escolha entre Dados de Tick hiper-precisos ou dados leves de Barras de 1 Minuto para análise histórica de longo prazo.
- Renderização Inteligente: Projetado para lidar com grandes quantidades de dados sem travar sua plataforma.
🛠️ Como Usá-lo para aprendizado quando não estiver negociando:
- Role para a data desejada no gráfico.
- Clique em "Modo: Âncora" no painel de UI.
- Arraste as duas linhas verticais pontilhadas para encapsular o swing de preço exato ou sessão de trading que deseja analisar.
- O Perfil de Volume é gerado instantaneamente. Você pode dar zoom no gráfico de 1 minuto para inspecionar os pontos exatos de entrada, desequilíbrios e retestes da Área de Valor sem que o perfil perca sua posição!
Assuma o controle dos seus gráficos. Pare de negociar padrões de varejo e comece a negociar volume institucional.
Resumo
An interactive on-chart UI panel enables quick toggling between dynamic Screen Mode and fixed Anchor Mode, profile position adjustments, visual customization, and switching between Buy/Sell Split and Delta Dominance volume coloring. The tool offers deep order flow insights, including visualization of aggressive buying versus selling, automatic detection of volume imbalances, and identification of High Volume Nodes (HVN) and Low Volume Nodes (LVN).
It displays dynamic Value Area High (VAH), Value Area Low (VAL), and Point of Control (POC) lines, with an option to extend naked POC lines as future support/resistance targets. Users can select data sources between tick data and 1-minute bars for optimized performance and historical analysis. The indicator is engineered for efficient rendering to handle large datasets without platform lag.
Avaliações de clientes
5 | 50 % | |
4 | 50 % | |
3 | 0 % | |
2 | 0 % | |
1 | 0 % |


![Logótipo de "High-Low Divergence [Iridio Capital]"](https://cdn.ctrader.com/image/webp/443c4661-7abb-40f1-842f-4b6ec560649b_40914)


