
Descrição
O que é um Indicador de Linha de Tendência?
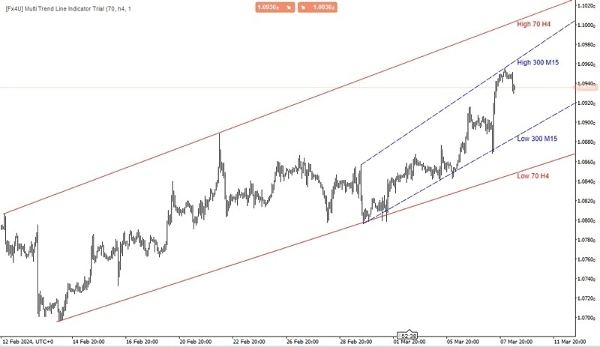
Um indicador de linha de tendência é uma ferramenta de análise técnica usada por traders e analistas para identificar a direção e a força de uma tendência em um mercado financeiro. Baseia-se no desenho de uma linha reta que conecta dois ou mais pontos de preço em um gráfico. O objetivo principal de uma linha de tendência é representar visualmente a direção geral do movimento de preços ao longo de um período específico.
Indicador de Linha de Tendência Multi Timeframe
A função principal de um indicador de linha de tendência multi timeframe é fornecer aos traders uma perspectiva mais ampla das tendências do mercado, agregando informações de vários períodos de tempo. Ao analisar tendências em múltiplos timeframes, os traders podem tomar decisões mais informadas sobre potenciais pontos de entrada e saída, bem como a direção geral do mercado.
Esse tipo de indicador geralmente permite que os traders personalizem os timeframes que desejam analisar e tracem linhas de tendência de acordo. Pode ser uma ferramenta valiosa para identificar níveis-chave de suporte e resistência, reversões de tendência e continuações de tendência em diferentes timeframes, auxiliando assim os traders a tomar decisões de negociação mais precisas.
Existem vários tipos de linhas de tendência, incluindo:
- Linha de Tendência Ascendente: Esta é desenhada conectando dois ou mais fundos sucessivos em um gráfico de preços. Sugere uma tendência ascendente, indicando que os preços estão geralmente subindo ao longo do tempo.
- Linha de Tendência Descendente: Por outro lado, uma linha de tendência descendente é desenhada conectando dois ou mais topos sucessivos em um gráfico de preços. Sugere uma tendência descendente, indicando que os preços estão geralmente caindo ao longo do tempo.
- Linha de Tendência Horizontal: Também conhecidas como linhas de suporte ou resistência, são desenhadas horizontalmente para indicar áreas onde o movimento do preço tende a estagnar ou reverter.
Os traders frequentemente usam linhas de tendência em conjunto com outros indicadores técnicos e métodos de análise para tomar decisões de negociação informadas. Quando uma linha de tendência é rompida ou violada, isso pode indicar uma possível mudança na direção da tendência, fornecendo sinais de negociação para os investidores.
Meus outros produtos:
https://ctrader.com/products/346
https://ctrader.com/products/336
https://ctrader.com/products/343
https://ctrader.com/products/347
https://ctrader.com/products/148
Resumo
Avaliações de clientes
5 | 67 % | |
4 | 0 % | |
3 | 33 % | |
2 | 0 % | |
1 | 0 % |
![Logótipo de "[Fx4U] GBPUSD - Price Action"](https://cdn.ctrader.com/image/webp/d80b34fc-da3c-4f01-a321-456450665649_26190)

![Logótipo de "[Fx4U] CADJPY - Price Action"](https://cdn.ctrader.com/image/webp/1ba81247-b6b7-4f3c-a297-fa3eb1d57fe1_26195)

![Logótipo de "[Fx4U] AUDCHF - Price Action"](https://cdn.ctrader.com/image/webp/0a22e9aa-c83b-42cd-b0b8-c1a2da593207_26148)

![Logótipo de "[Fx4U] EURAUD - Price Action"](https://cdn.ctrader.com/image/webp/baf8dde4-1ef3-4beb-8ae2-0fed8320f65d_26177)


