
Mô tả
Các chỉ báo hỗ trợ và kháng cự đa khung thời gian thường cho phép các nhà giao dịch hình dung các mức này trên các khung thời gian khác nhau, chẳng hạn như biểu đồ hàng giờ, hàng ngày, hàng tuần hoặc hàng tháng. Bằng cách kết hợp nhiều khung thời gian, các nhà giao dịch có thể có cái nhìn rộng hơn về vị trí các mức giá chính và cách chúng có thể ảnh hưởng đến hành động giá.
Loại chỉ báo này có thể giúp các nhà giao dịch đưa ra quyết định giao dịch thông minh hơn bằng cách xác định các mức hỗ trợ và kháng cự quan trọng có thể ảnh hưởng đến biến động giá trên nhiều khung thời gian khác nhau. Nó cũng có thể giúp các nhà giao dịch dự đoán các cơ hội đảo chiều hoặc phá vỡ khi giá tiếp cận các mức này trên nhiều khung thời gian.
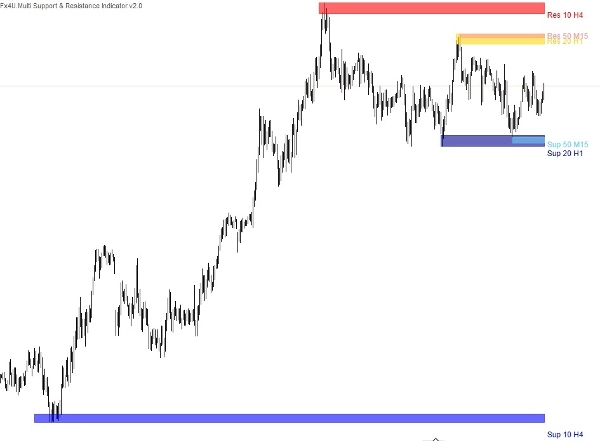
Có ba loại mức hỗ trợ & kháng cự:
Ba chỉ báo hỗ trợ và kháng cự được tích hợp trong chỉ báo duy nhất này cho phép bạn vẽ các vùng cung và cầu trên biểu đồ với các cài đặt sau.
- Giá trị khoảng thời gian.
- Khung thời gian.
- Số lượng cực trị – Đây là số điểm Hỗ trợ/Kháng cự hiện tại + quá khứ được hiển thị. Ví dụ, nếu chúng ta chọn 2, chỉ báo sẽ chọn thêm một điểm Hỗ trợ và Kháng cự khác trong quá khứ.
- Tên và màu sắc của chỉ báo.
Các mức hỗ trợ và kháng cự quan trọng trên các khung thời gian cao hơn thường có trọng lượng lớn hơn và bằng cách sử dụng chỉ báo đa khung thời gian, các nhà giao dịch có thể xác nhận tầm quan trọng của một mức nếu nó xuất hiện nhất quán trên nhiều khung thời gian. Sự xác nhận này tăng độ tin cậy của mức đó và nâng cao sự tự tin của các nhà giao dịch trong các quyết định giao dịch của họ.
Các sản phẩm khác của tôi:
https://ctrader.com/products/346
https://ctrader.com/products/336
https://ctrader.com/products/343
https://ctrader.com/products/347
https://ctrader.com/products/147
Tóm tắt
The indicator consolidates three types of support and resistance levels into a single tool, allowing users to plot supply and demand zones with customizable settings such as period value, timeframe, the number of extremum points (current plus past support/resistance points), and indicator name and color. This multi-timeframe approach helps traders identify levels that carry more weight when confirmed across different timeframes, enhancing the reliability of these levels for decision-making.
By visualizing these critical zones, the indicator aids in anticipating potential price reversals or breakout opportunities. It supports a broader market overview, enabling more informed trading strategies based on the interaction of price with established support and resistance across various time horizons.
Đánh giá của khách hàng
5 | 33 % | |
4 | 67 % | |
3 | 0 % | |
2 | 0 % | |
1 | 0 % |
![Logo "[Fx4U] GBPUSD - Price Action"](https://cdn.ctrader.com/image/webp/d80b34fc-da3c-4f01-a321-456450665649_26190)

![Logo "[Fx4U] CADJPY - Price Action"](https://cdn.ctrader.com/image/webp/1ba81247-b6b7-4f3c-a297-fa3eb1d57fe1_26195)

![Logo "[Fx4U] AUDCHF - Price Action"](https://cdn.ctrader.com/image/webp/0a22e9aa-c83b-42cd-b0b8-c1a2da593207_26148)

![Logo "[Fx4U] EURAUD - Price Action"](https://cdn.ctrader.com/image/webp/baf8dde4-1ef3-4beb-8ae2-0fed8320f65d_26177)


