
الوصف
يحدد مناطق اختلال السوق (فجوات القيمة العادلة أو FVGs) ويعرضها على الرسم البياني بطريقة ذكية. على عكس المؤشرات الأخرى، يتكيف هذا المؤشر في الوقت الحقيقي مع حركة السعر، مضبطًا حجمه، واستمراريته، وأهميته. إنه مثالي للمتداولين الذين يبحثون عن أهداف واضحة وإدارة متقدمة للفجوات البصرية.
✨ الميزات الرئيسية
- تعديل الفجوة الديناميكي
المنطق: إذا لمس السعر جزءًا من FVG (مثلًا، يلامس الحد السفلي)، يقوم المؤشر تلقائيًا بتغيير حجم الفجوة لتعكس فقط المنطقة غير المغطاة.
الفائدة: يتجنب الإشارات الخاطئة ويحتفظ فقط بالفجوات ذات الإمكانات الحقيقية نشطة. - ملء نقطة المنتصف
المنطق: يرسم خطًا في مركز الفجوة. إذا لمس السعر هذا الخط، تعتبر FVG "مملوءة" ويمكن إزالتها (قابلة للتكوين).
الفائدة: يتطلب فقط 50% من التلامس لتأكيد الإغلاق، مما يفلتر الضوضاء والصفقات المبكرة. - الإسقاط اللانهائي حتى يتم الملء
المنطق: تمتد الفجوات إلى المستقبل بلا حدود (لا تختفي بعد عدد معين من الشموع).
الفائدة: يوفر مرجعًا مستمرًا حتى يحل السوق الاختلال. - تنظيف تلقائي للفجوات الملغاة
المنطق: يزيل تلقائيًا الفجوات القديمة عندما يتم ملؤها بالكامل.
الفائدة: يحافظ على نظافة الرسم البياني ويركز على المناطق النشطة. - تخصيص بصري متقدم
الخيارات: ألوان مختلفة للفجوات الصعودية (الأخضر) والهبوطية (الأحمر). ضبط الشفافية لتجنب ازدحام الرسم البياني.
الفائدة: يتكيف مع أي أسلوب تداول أو استراتيجية بصرية.
🎯 كيفية استخدامه في التداول؟
تحديد المناطق الرئيسية:
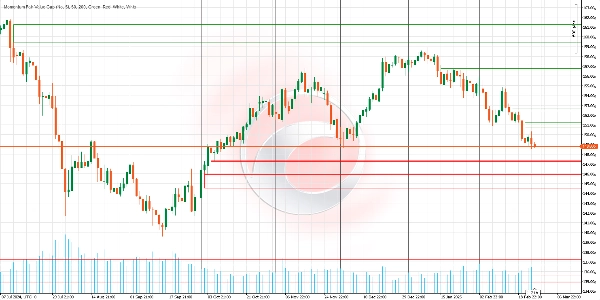
- FVG صعودي (أخضر): منطقة فقد فيها المشترون قوتهم مؤقتًا.
→ الاستراتيجية: ابحث عن فرص شراء خلال التراجعات إلى هذه المنطقة. - FVG هبوطي (أحمر): منطقة تم تجاوز البائعين فيها.
→ الاستراتيجية: ابحث عن فرص بيع خلال الارتفاعات إلى هذه المنطقة.
التفاعل مع السعر:
- إذا تم تعديل الفجوة ديناميكيًا (تقليل حجمها)، فهذا يشير إلى أن السوق يختبر المنطقة ولكن بدون تأكيد.
- إذا تمت إزالة الفجوة (بملء كامل أو نقطة المنتصف)، اعتبر الاختلال مصححًا.
🔍 التأكيد باستخدام أدوات أخرى
ادمج FVGs مع مستويات الدعم/المقاومة، الحجم، أو RSI لتصفية الإشارات.
📋 مقارنة الميزات
___________________________________________________________________________________
الميزة فجوة القيمة العادلة للحركة المؤشرات التقليدية
________________________________________________________________________________
الاستمرارية---------------- تمتد الفجوات حتى يتم ملؤها ----------------------- تختفي بعد عدد معين من الشموع
دقة الإغلاق-------- خيار تأكيد 50% --------------------- يتطلب ملء الفجوة بالكامل
المرونة ------------------ يعيد تغيير الحجم مع السعر ------------------------- مستويات ثابتة وغير قابلة للتغيير
التركيز البصري---------------- يزيل الفجوات غير ذات الصلة ----------------------- يزدحم الرسم البياني بالبيانات السابقة
📝 مثال عملي
سيناريو في EURUSD (1H):
تتشكل فجوة قيمة عادلة صعودية (خضراء) بعد شمعة هبوطية واضحة. بعد أيام، يعود السعر ويتراجع، ملامسًا الحد السفلي للفجوة لكنه لا يملأها. يقوم المؤشر تلقائيًا بتقليل حجم الفجوة. أخيرًا، يلمس السعر نقطة المنتصف (الخط المركزي)، مما يؤدي إلى إزالة الفجوة. يدخل المتداول صفقة بيع بعد تأكيد الرفض في المنطقة.
مؤشرات متجر Ctrader:
الهيكل السوقي الديناميكي
تحليل نقاط التحول
فيبوناتشي الخطي
انحدار متعدد الأطر الزمنية
انحياز الشمعة متعدد المستويات
المتعقب
الملخص
Key features include:
- Dynamic Gap Adjustment: Automatically resizes gaps when price partially touches them, reducing false signals.
- MidPoint Fill: Marks the gap centerline; if price touches it, the gap is considered filled and can be removed, requiring only 50% contact for confirmation.
- Infinite Projection: Gaps extend indefinitely until filled, maintaining persistent market imbalance references.
- Automatic Cleanup: Removes fully filled gaps to keep charts focused on active zones.
- Advanced Visual Customization: Uses distinct colors for bullish (green) and bearish (red) gaps with adjustable transparency.
In trading, bullish FVGs indicate zones where buyers lost strength, suggesting buying opportunities on pullbacks; bearish FVGs mark where sellers were overtaken, indicating selling opportunities on rallies. The indicator’s dynamic interaction with price helps confirm market imbalance resolution.
It is recommended to combine this indicator with other tools like support/resistance levels, volume, or RSI for signal filtering.
تقييمات العملاء
5 | 0 % | |
4 | 100 % | |
3 | 0 % | |
2 | 0 % | |
1 | 0 % |


