
Descrição
Indicador Fair Value Gap
Visão Geral
O indicador Fair Value Gap é uma ferramenta de precisão para traders de price-action que desejam identificar, acompanhar e validar desequilíbrios de mercado de curto prazo. Ele detecta automaticamente Fair Value Gaps (FVGs) de alta e baixa, destaca zonas ativas (não mitigadas) no seu gráfico e registra quando o preço posteriormente preenche (mitiga) essas zonas. Leve e sem repintura (opera em barras fechadas), este indicador é projetado para análise confiável em negociações ao vivo e backtesting.
Principais Características
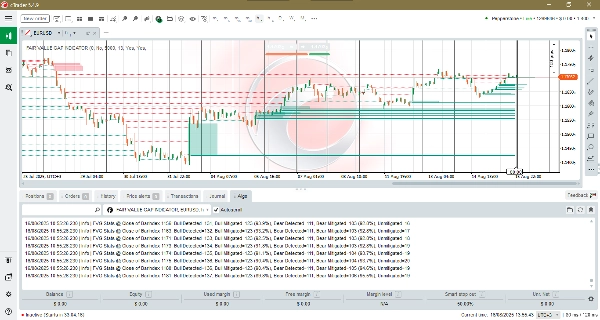
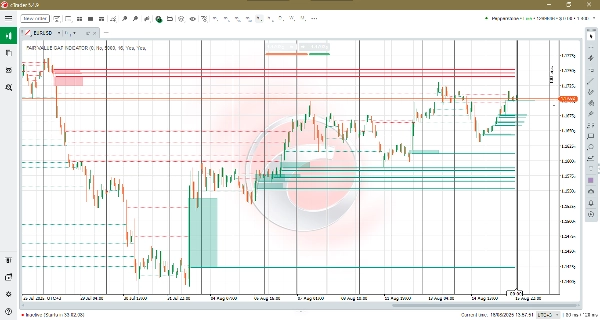
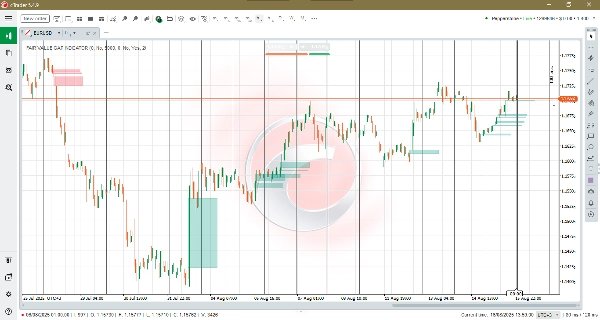
- Detecção Automática de FVG: Lógica robusta de 3 barras identifica zonas de desequilíbrio tanto de alta quanto de baixa e plota zonas retangulares limpas no gráfico.
- Rastreamento de Mitigação: Quando o preço fecha através de uma zona, o indicador remove a caixa e pode desenhar uma linha pontilhada persistente de mitigação para referência histórica.
- Sobreposição de Nível Não Mitigado: Mostra os N níveis não preenchidos mais recentes como linhas horizontais em negrito desenhadas desde a barra de detecção até a barra atualmente em formação. Isso facilita a visualização rápida dos Fair Value Gaps ativos (não mitigados) e a identificação rápida de seus níveis de preço.
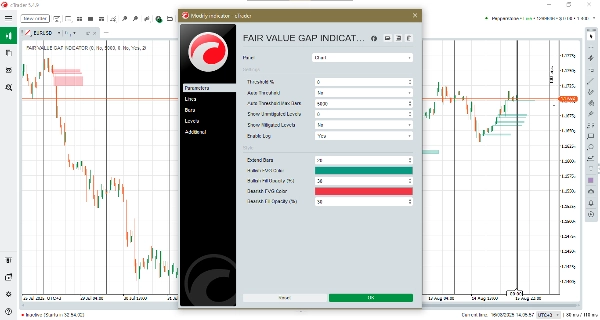
- Limiares Manuais e Automáticos: Escolha um limiar relativo fixo ou ative o Limite Automático para permitir que o indicador se adapte à atividade recente do mercado.
- Máximo de Barras para Limite Automático: Controla o tamanho da janela deslizante usada para calcular o limiar automático. Valores maiores suavizam o limiar (estável ao longo de um histórico mais longo); valores menores o tornam mais responsivo à volatilidade recente.
- Visuais Personalizados e Projeção: Defina o comprimento de extensão (até onde as caixas projetam), cor e opacidade do preenchimento para zonas de alta e baixa para combinar com o estilo do seu gráfico.
- Registro no Terminal: Linhas de log compactas reportam o total de FVGs detectados, mitigações e contagens atuais não mitigadas — ideal para validação e ajuste de estratégia.
- Lógica de Barra Fechada: Projetado para rodar uma vez por barra fechada para minimizar repintura.
Benefícios
- Referências claras para negociações: Encontre rapidamente zonas de desequilíbrio que podem atuar como alvos de retorno, áreas de reação ou referências para gerenciamento de trades.
- Validação e estatísticas: Use logs do terminal e percentuais de mitigação para validar sinais e ajustar a sensibilidade da sua estratégia.
- Sensibilidade adaptável: Limite Automático + Máximo de Barras permite que o indicador se comporte de forma confiável em mercados calmos e voláteis sem necessidade de ajustes manuais constantes.
- Visuais compactos e não intrusivos: Pegada visual mínima mantém seus gráficos legíveis enquanto preserva o contexto essencial.
Ideal Para
Day traders, swing traders e scalpers que dependem de price-action e conceitos de desequilíbrio, além de analistas que validam reações de fluxo de ordens e desempenho de estratégias.
Conclusão
O indicador Fair Value Gap combina detecção precisa de desequilíbrios com análises de mitigação e limiares adaptativos, oferecendo uma visão focada e com baixo ruído dos desequilíbrios do mercado. Use-o para identificar potenciais retornos de preço, gerenciar trades de forma mais inteligente e medir com que frequência as zonas estão sendo preenchidas no seu mercado.
Resumo
Key features include automated FVG detection, mitigation tracking, and an overlay showing recent unmitigated levels as bold horizontal lines for easy visual scanning. Users can select manual or automatic thresholding to adapt sensitivity to market conditions, with adjustable parameters controlling the responsiveness of the auto threshold. Customizable visual settings allow traders to tailor the appearance of bullish and bearish zones.
The indicator operates on closed bars to minimize repainting, ensuring reliable signals for live trading and backtesting. Terminal logging provides concise statistics on detected gaps and mitigations, aiding validation and strategy tuning.
Suitable for day traders, swing traders, scalpers, and analysts, the Fair Value Gap Indicator supports markets including Forex, indices, commodities, cryptocurrencies, and stocks. It offers a focused, low-noise view of market imbalances to assist in identifying potential price return targets and managing trades.
Avaliações de clientes
5 | 100 % | |
4 | 0 % | |
3 | 0 % | |
2 | 0 % | |
1 | 0 % |


