
UTBotAlerts
Indicator
1 purchases
Version 1.0, Jun 2026
Windows, Mac
5.0
Reviews: 1
Since 04/09/2025
1
Sales
Description
The UT Bot is a popular, highly customizable technical analysis indicator to identify potential trend reversals and momentum shifts. It is designed to simplify trading decisions by plotting clear entry and exit signals directly onto the price chart.
Key Features & Components
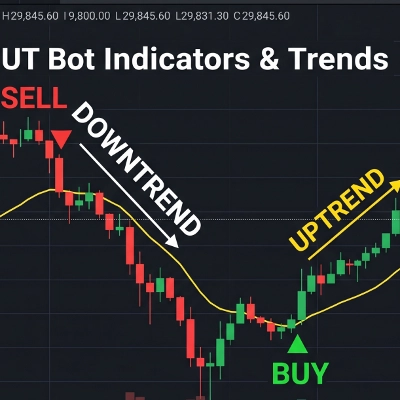
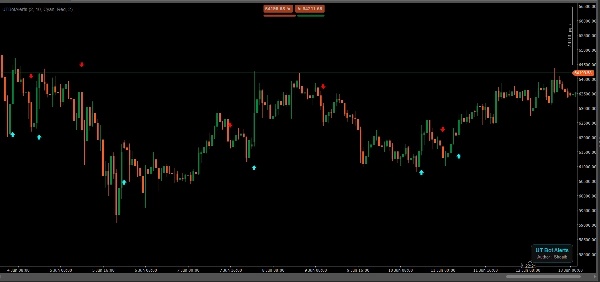
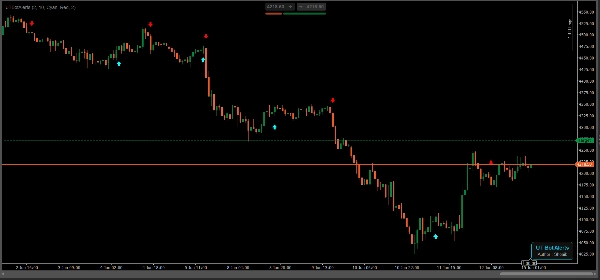
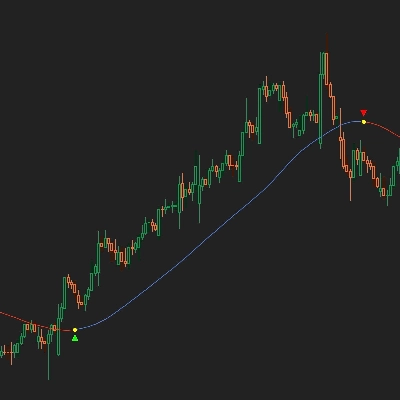
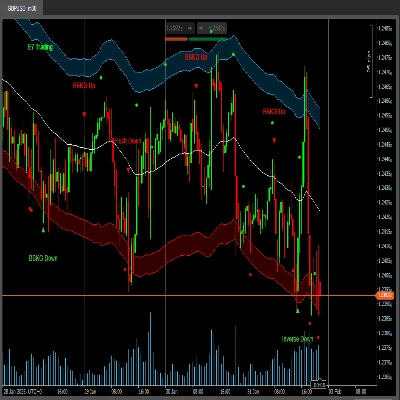
- Buy and Sell Signals: The indicator plots Green "BUY" (Up) arrows and Red "SELL" (Down) arrows to highlight potential trend changes. As seen in the chart, a sell signal appears at the start of a market decline, while a buy signal triggers as momentum shifts upward.
- Trend Tracking: It helps traders visually distinguish between a Downtrend (bearish price action moving below a baseline) and an Uptrend (bullish price action climbing upward).
- Candlestick Integration: The signals overlay seamlessly on standard candlestick price charts, making it easy to see the exact price levels where the bot triggers.
- Volatility-Based Sensitivity: UT Bot typically relies on a combination of the Average True Range (ATR) and a trailing stop mechanism, allowing traders to adjust its sensitivity to filter out market noise or capture longer-term trends.
Summary
AI summary
UTBotAlerts is a technical analysis indicator designed to identify potential trend reversals and momentum shifts in financial markets. It visually signals buy and sell opportunities by plotting green "BUY" arrows and red "SELL" arrows directly on candlestick price charts, aiding traders in recognizing entry and exit points. The indicator distinguishes between uptrends and downtrends by tracking price action relative to a baseline, helping users interpret market direction clearly. UTBotAlerts incorporates volatility-based sensitivity adjustments using the Average True Range (ATR) combined with a trailing stop mechanism, allowing customization to filter market noise or capture longer-term trends. This indicator supports trend analysis and overlays seamlessly on standard price charts, enhancing decision-making through clear, actionable signals.
Indicator profile
Indicator category
Trend
Output type
Signals
Data requirements
Bars only
Supported signals
Trend strength
Discussion
Customer reviews
5.0
Reviews: 1
5 | 100 % | |
4 | 0 % | |
3 | 0 % | |
2 | 0 % | |
1 | 0 % |
Customer reviews
June 29, 2026
UT Bot Alerts is a lightweight and stable implementation of the classic ATR-based trend reversal indicator. It provides clean BUY/SELL signals, adapts well to changing volatility conditions and works consistently across Forex and Gold markets. Its simplicity and reliability make it particularly useful as a trend filter or confirmation tool.
FAQ
Supertrend
Volume
ATR
Products available through cTrader Store, including trading bots, indicators and plugins, are provided by third-party developers and made available for informational and technical access purposes only. cTrader Store is not a broker and does not provide investment advice, personal recommendations or any guarantee of future performance.


Price
Since 04/09/2025
1
Sales