present
Daftar dan dapatkan diskon $50 untuk pembelian pertama Anda
Trading product for IPDA Data Range Dashboard Indikator Breaker Block Premium/Discount , image 1
IPDA Data Range Dashboard
Indikator
Versi 1.0, Aug 2026
Windows, Mac
5.0
Ulasan: 1
Trading product for IPDA Data Range Dashboard Indikator Breaker Block Premium/Discount , image 2
Trading product for IPDA Data Range Dashboard Indikator Breaker Block Premium/Discount , image 3
Trading product for IPDA Data Range Dashboard Indikator Breaker Block Premium/Discount , image 4
Trading product for IPDA Data Range Dashboard Indikator Breaker Block Premium/Discount , image 5
Sejak 07/05/2026
5
Penjualan
63
Instal gratis

Deskripsi

Rentang data IPDA adalah salah satu konsep paling mendasar dalam bimbingan ICT — dan hampir setiap versi indikator ini memiliki kekurangan yang sama: ia menghitung "hari" menggunakan kerangka waktu yang sedang Anda gunakan, sehingga rentang tersebut salah saat Anda tidak menggunakan grafik Harian.

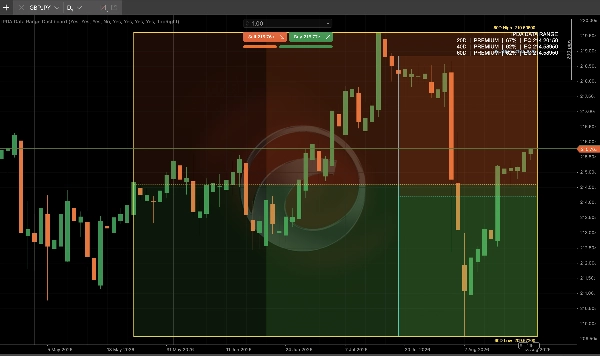
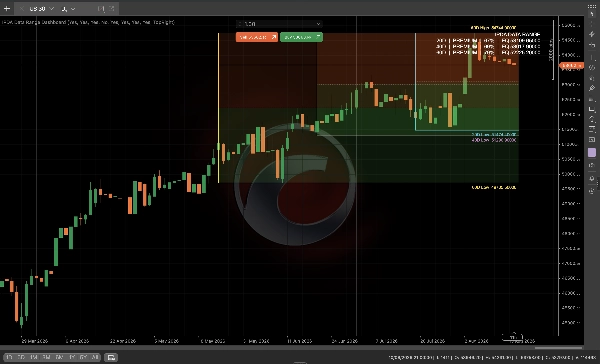
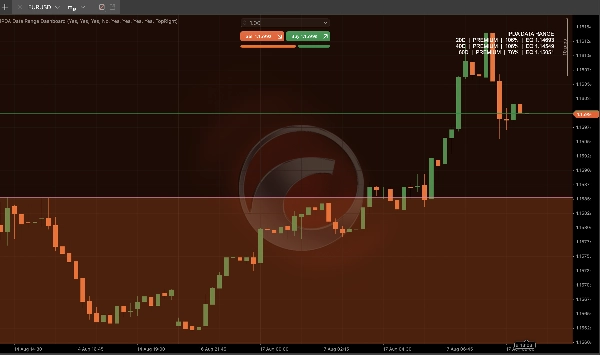
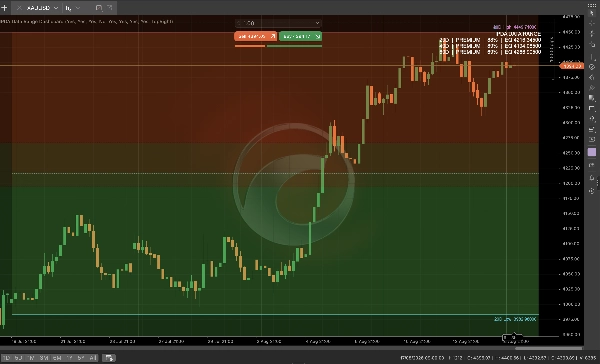
Dasbor Rentang Data IPDA memperbaiki hal itu. Ia mengaitkan setiap rentang ke lilin harian sejati di balik layar, sehingga zona peninjauan kembali institusional 20/40/60 hari Anda akurat apakah Anda berdagang di 4H, 15m, atau Harian itu sendiri.

Apa yang Anda dapatkan:

  • Rentang IPDA 20/40/60 hari, masing-masing dapat diaktifkan secara independen
  • Pewarnaan Premium/Diskon dengan garis Keseimbangan langsung untuk setiap rentang
  • Penanda Pergeseran Kuartalan — bendera saat harga menutup di luar ekstrem 60 hari sebelumnya, sinyal nyata dari perluasan rentang institusional
  • Panel dasbor langsung yang menunjukkan zona setiap rentang, persentase posisi, dan harga keseimbangan secara sekilas
  • Sangat akurat pada kerangka waktu grafik apa pun — celah inti di setiap versi yang ada

Dibuat untuk trader yang menjalankan model bias kerangka waktu lebih tinggi yang membutuhkan konteks premium/diskon tanpa harus beralih ke grafik Harian setiap saat. Pasang sekali, berdaganglah pada kerangka waktu apa pun yang Anda suka.

Ringkasan

Ringkasan AI
The IPDA Data Range Dashboard is a trading indicator designed to provide accurate institutional price range analysis anchored to true daily candles. It calculates 20-, 40-, and 60-day IPDA lookback ranges independently of the chart timeframe, ensuring precision whether used on 15-minute, 4-hour, or daily charts. Key features include toggleable IPDA ranges, premium and discount zones with live equilibrium lines, and quarterly shift alerts that flag when price closes beyond prior 60-day extremes, indicating institutional range expansions. The dashboard panel displays each range’s zone, position percentage, and equilibrium price for quick reference. This tool addresses common inaccuracies in other IPDA indicators by maintaining consistent daily anchoring, making it suitable for traders employing higher-timeframe bias models who require premium/discount context without switching chart timeframes. The indicator supports visualization outputs and requires bar data for operation. It integrates concepts related to market structure such as breaker blocks, fair value gaps, breaks of structure, and support/resistance zones.
Profil indikator
Kategori indikator
Struktur pasar (SMC)
Tipe output
Visualisasi
Sinyal
Persyaratan data
Hanya batang

Ulasan pelanggan

5.0
Ulasan: 1
5
100 %
4
0 %
3
0 %
2
0 %
1
0 %
Ulasan pelanggan
August 19, 2026
A focused and well-executed IPDA analysis tool. The 20/40/60-day ranges, Premium/Discount zones, equilibrium levels and dashboard worked consistently during testing. Most importantly, the same Daily-derived equilibrium values were maintained across M2, H1 and D1 charts, supporting the product's core multi-timeframe claim. The interface can become visually dense with all ranges enabled, but individual toggles make this manageable. Overall, a useful and stable higher-timeframe context tool.

Diskusi

Pertanyaan umum

Breaker Block
Premium/Discount
Fair Value Gap
AI-assisted
BOS
Volume
Support & Resistance
Produk-produk yang tersedia melalui cTrader Store, termasuk bot trading, indikator, dan plugin, disediakan oleh pengembang pihak ketiga serta hanya ditujukan untuk akses teknis dan informasi. cTrader Store bukan broker dan tidak menyediakan saran investasi, rekomendasi pribadi, atau jaminan apa pun tentang kinerja di masa mendatang.

Produk lain dari penulis ini

Indikator
AI-assisted
Order Block
+5
The daily bias estimator indicator uses ICT concepts to show whether the chart is bullish or bearish on multi-time frame
Indikator
ATR
BOS
+5
Full ICT/SMC 4-step setup checker that alerts a long or short setup.
Indikator
Volume
Fibonacci
+5
Classic 9:30 Opening Range Breakout — auto-plots the range, flags volume-confirmed breakouts long or short, live.
Indikator
Flag
VWAP
+5
Session VWAP with statistical deviation bands, gradient cloud, and live rejection alerts — see exactly how stretched pri
Indikator
MSS
AI-assisted
+5
Live ICT Silver Bullet detection: liquidity sweeps, structure shifts, and killzone-gated FVGs, graded and glowing in rea
Indikator
ATR
Key Levels
+5
CPR indicator that actually predicts the day ahead: width percentile scoring for breakout-day detection
Indikator
Triangle
Double Top
+5
Know which liquidity sweeps are real. Auto-tracks EQH/EQL and confirms genuine reversals, not just broken levels.
Indikator
BOS
EMA
+5
Directional volume heatmap: see if a price zone was built on buying or selling, not just how much.
Indikator
ATR
MSS
+5
Grades ICT Unicorn setups (Breaker Block + FVG confluence) into PRIME / SETUP / WATCH, with retest & RR targets.
Indikator
BOS
MSS
+5
One indicator, full ICT/SMC picture — structure, OBs, FVGs, liquidity, Premium/Discount — with graded PRIME/SETUP signal
Indikator
ATR
Volume
+5
Order blocks with measured hold-rate stats and confidence scoring — not just zones on a chart.
Indikator
BOS
CHOCH
+5
BOS/CHoCH signals confirmed by liquidity sweep + FVG confluence, with a live conviction score.

Anda mungkin juga suka

Indikator
BOS
CHOCH
+5
A professional-grade cTrader indicator for traders following the Inner Circle Trader (ICT) methodology.
Indikator
The Multi-Timeframe Candle Indicator displays candles from multiple timeframes in one window, enhancing market analysis!
Indikator
XAUUSD
Professional Volume Profile Indicator - Shows volume distribution, POC, Value Areas & Buy/Sell pressure.
Indikator
Prop
Forex
+13
🎯Automatically detects and visualizes classical chart patterns using multi-timeframe swing point analysis.
Indikator
Forex
Crypto
+4
Auto Trend Line Indicator for cTrader
Indikator
AI
ATR
+27
Support and Resistance with signals
Indikator
MACD
Forex
+2
a revolutionary indicator that integrates volume into MACD.
Indikator
BOS
CHOCH
+3
Identifies HH, HL, LH, and LL swing points using fractals. Essential for Smart Money Concepts and price action.
Indikator
Forex
BTCUSD
+13
Multi-symbol Inside Bar Scanner with dashboard & breakout alerts
Indikator
BOS
CHOCH
+5
BOS/CHoCH signals confirmed by liquidity sweep + FVG confluence, with a live conviction score.
Indikator
RSI
Forex
+12
Indicator pattern signal moment
Indikator
ATR
Volume
+4
This allows traders to see not just the trend, but whether the momentum itself is overextended.
Indikator
Displays the previous day's, last week's, and last month's highest and lowest price levels on your chart.
Indikator
SmartFibonacci — automatic Fibonacci retracements & extensions with swing detection, alerts and clean labels for cTrader
Indikator
ATR
MSS
+5
Grades ICT Unicorn setups (Breaker Block + FVG confluence) into PRIME / SETUP / WATCH, with retest & RR targets.
Indikator
BOS
Fibonacci
+4
Automatically draws major trading sessions, killzones, and SMC daily liquidity targets directly on your cTrader charts.
Indikator
ATR
EMA
+5
The indicator displays potential reversal zones (support/resistance) on the chart based on the average range (High–Low)
Indikator
Zero Lag MACD delivers ultra-responsive trend and divergence signals with minimal lag, empowering timely Forex entries.

Harga

Sejak 07/05/2026
5
Penjualan
63
Instal gratis