
Description
Gaps d'ouverture hebdomadaires et quotidiens — Indicateur NWOG & NDOG
Visualisation professionnelle des gaps d'ouverture pour les traders institutionnels et les participants sérieux du retail
APERÇU
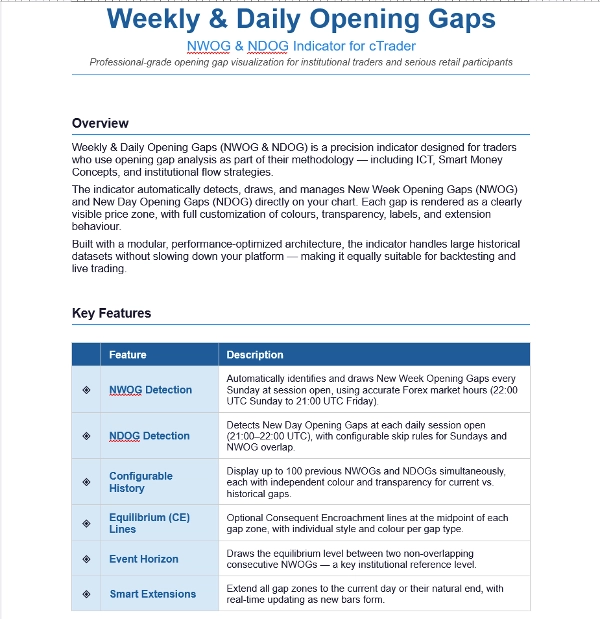
Les Gaps d'Ouverture Hebdomadaires et Quotidiens (NWOG & NDOG) sont un indicateur de précision conçu pour les traders qui utilisent l'analyse des gaps d'ouverture dans leur méthodologie — incluant ICT, Smart Money Concepts, et les stratégies de flux institutionnels.
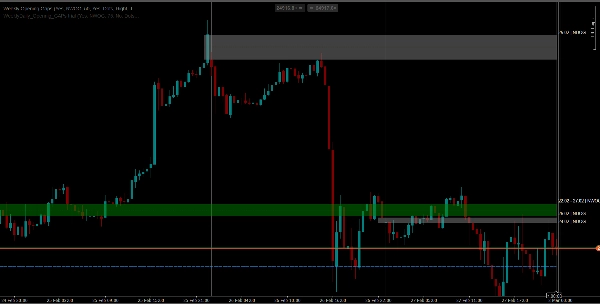
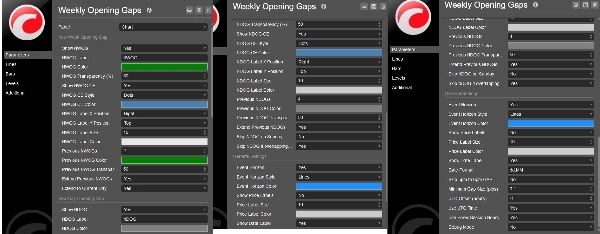
L'indicateur détecte, dessine et gère automatiquement les Gaps d'Ouverture de Nouvelle Semaine (NWOG) et de Nouveau Jour (NDOG) directement sur votre graphique. Chaque gap est rendu comme une zone de prix clairement visible, avec une personnalisation complète des couleurs, de la transparence, des étiquettes et du comportement d'extension.
Construit avec une architecture modulaire optimisée pour la performance, l'indicateur gère de grands ensembles de données historiques sans ralentir votre plateforme — ce qui le rend également adapté au backtesting et au trading en direct.
FONCTIONNALITÉS CLÉS
◈ Détection NWOG
◈ Détection NDOG avec règles de saut configurables pour les dimanches et le chevauchement NWOG.
◈ Historique configurable — Affiche jusqu'à 100 NWOG précédents
◈ Lignes d'Équilibre (CE)
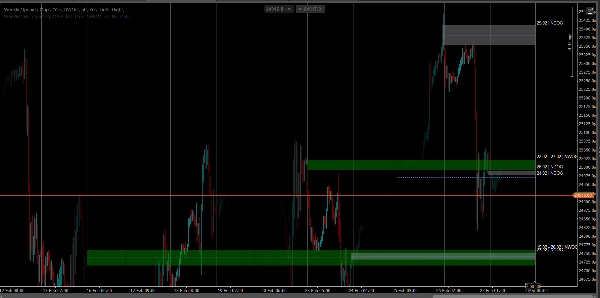
◈ Horizon d'Événement — Trace le niveau d'équilibre entre deux NWOG consécutifs non chevauchants
◈ Extensions Intelligentes — Étend toutes les zones de gap jusqu'au jour actuel ou à leur fin naturelle, avec mise à jour en temps réel à mesure que de nouvelles barres se forment.
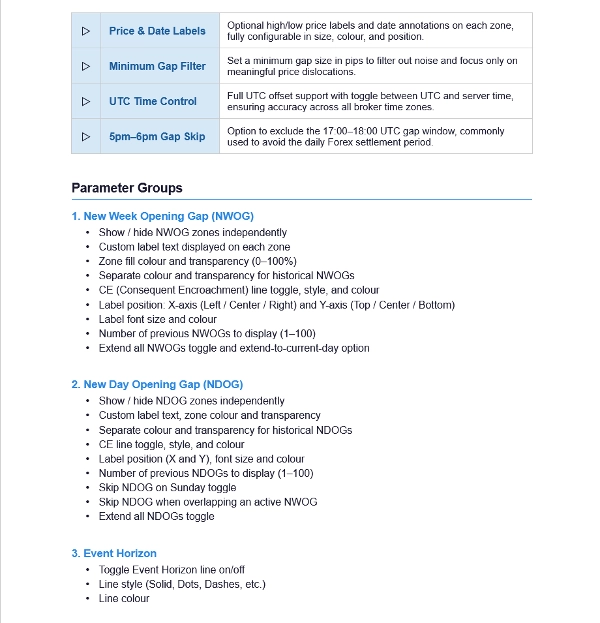
◈ Étiquettes de Prix & Date
◈ Filtre de Gap Minimum
◈ Contrôle de l'Heure UTC
COMMENT ÇA FONCTIONNE
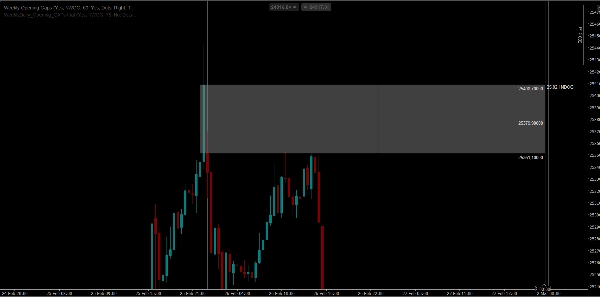
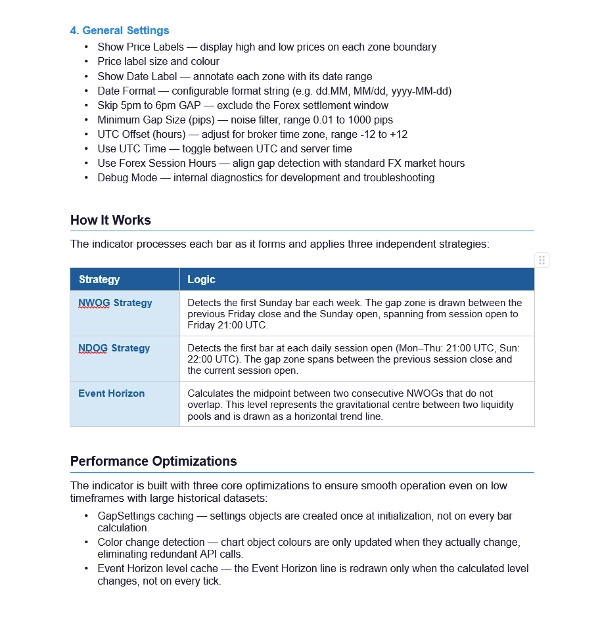
Stratégie NWOG — Détecte la première barre du dimanche chaque semaine. La zone de gap est tracée entre la clôture du vendredi précédent et l'ouverture du dimanche, s'étendant de l'ouverture de la session jusqu'à vendredi 21:00 UTC.
Stratégie NDOG — Détecte la première barre à chaque ouverture de session quotidienne (Lun–Jeu : 21:00 UTC, Dim : 22:00 UTC). La zone de gap s'étend entre la clôture de la session précédente et l'ouverture de la session actuelle.
Horizon d'Événement — Calcule le point médian entre deux NWOG consécutifs qui ne se chevauchent pas. Ce niveau représente le centre gravitationnel entre deux pools de liquidité et est tracé comme une ligne de tendance horizontale.
COMPATIBILITÉ
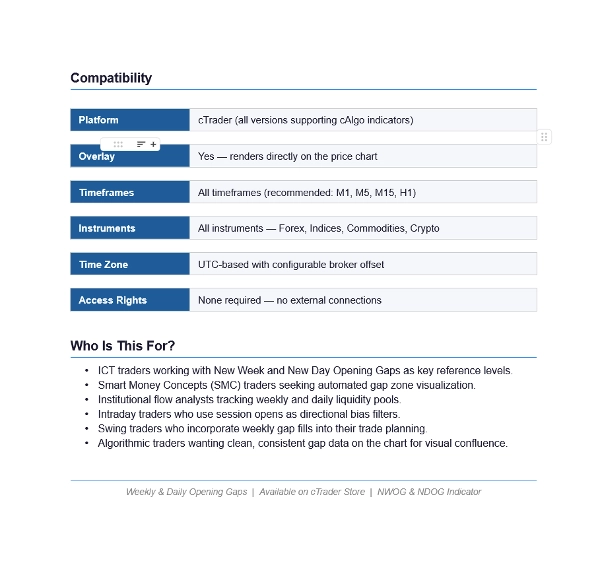
Plateforme : cTrader (toutes versions supportant les indicateurs cAlgo)
Superposition : Oui — rendu directement sur le graphique des prix
Unités de temps : Toutes les unités (recommandé : M1, M5, M15, H1)
Instruments : Tous — Forex, Indices, Matières premières, C
POUR QUI EST-CE ?
Traders ICT travaillant avec les Gaps d'Ouverture de Nouvelle Semaine et de Nouveau Jour comme niveaux de référence clés
Traders Smart Money Concepts (SMC) recherchant une visualisation automatisée des zones de gap
Analystes de flux institutionnels suivant les pools de liquidité hebdomadaires et quotidiens
Traders intraday utilisant les ouvertures de session comme filtres de biais directionnel
Traders swing incorporant les comblements de gaps hebdomadaires dans leur planification de trades
Traders algorithmiques souhaitant des données de gap propres et cohérentes sur le graphique pour une confluence visuelle
Résumé
Avis clients
5 | 0 % | |
4 | 100 % | |
3 | 0 % | |
2 | 0 % | |
1 | 0 % |


![Logo de "[Stellar Strategies] Inside Bar with Signals"](https://cdn.ctrader.com/image/webp/1d9e8bfa-3b2c-4440-bb37-5856902008a7_30683)


