
Description
🚀 Plus de 10 000 traders utilisent déjà nos indicateurs TOP 🏆 …et la communauté continue de grandir !
Découvrez pourquoi les professionnels nous choisissent – les outils les plus puissants de cTrader (indicateurs + algorithmes + cBots) vous attendent.
👉 Obtenez tous nos systèmes TOP ici :
Indicateurs du magasin Pinescriptlabs : cBots du magasin Pinescriptlabs : (cBot) Gold & BTC BreakoutSession Pivots(nouveau)
Projection de liquidité ZigZag Prix
Algorithme intelligent Trailing (nouveau)
Carte de liquidation à effet de levier
Prédiction basée sur Linreg & ATR
Support & SmartTrend
Résistance
Lignes
Sessions de Gap de juste valeur
Analyse
dynamique
de la structure
du marché
des points
de retournement
Régression
linéaire
Fibonacci
multi-échelle
Gradient de tendance dynamique
Suivi
du biais
multi-niveaux de chandeliers
Support
et résistance
automatiques
de tendance
lignes
Tous
les supports
et résistances
niveaux
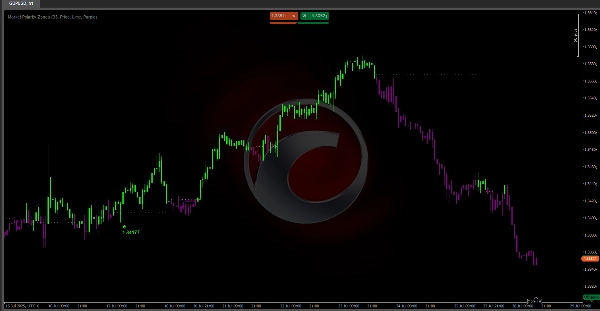
Zones de polarité du marché 📊
Que fait cet algorithme ?
Zones de polarité du marché est un indicateur avancé qui simplifie l’analyse du marché en identifiant automatiquement les phases haussières 🚀 ou baissières 🐻 et en marquant les niveaux clés où les retournements de tendance sont probables.
Idéal pour :
- Les traders en action de prix
- Les traders de swing
- Les scalpers,... qui ont besoin de repérer rapidement la direction du marché et des points d’entrée/sortie précis.
Comment fonctionne la logique ?
L’algorithme utilise deux moyennes mobiles Hull (HMA) avec des périodes différentes pour détecter les changements de momentum et définit des niveaux dynamiques comme suit :
- Détecte les croisements HMA pour identifier les changements de tendance.
- Définit des niveaux automatiques :
-
- Croisement haussier → Marque le creux comme niveau de support
- Croisement baissier → Marque le sommet comme niveau de résistance
- Maintient le niveau actif jusqu’à ce qu’un nouveau croisement se produise.
Ce que vous verrez sur votre graphique :
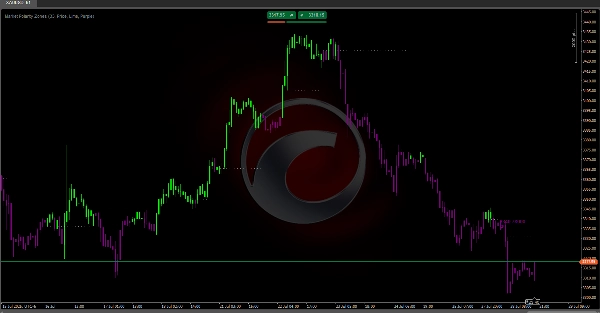
🎨 Système de couleurs intuitif :
- Chandeliers verts 🟢 : Prix au-dessus du niveau (zone haussière – chercher des achats)
- Chandeliers violets 🟣 : Prix en dessous du niveau (zone baissière – chercher des ventes)
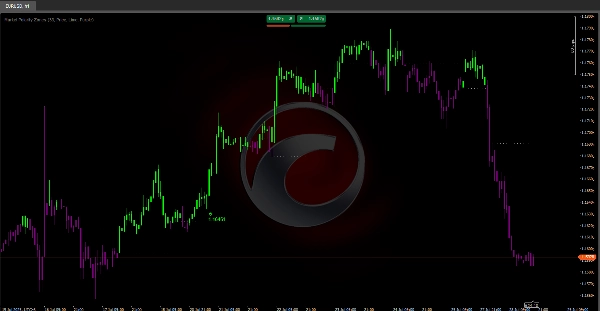
📉 Lignes de niveau dynamiques :
- Lignes horizontales en pointillés marquant le niveau de polarité actif
- S’étendent automatiquement tant que le niveau reste valide
- N’apparaissent que lorsque le niveau se stabilise
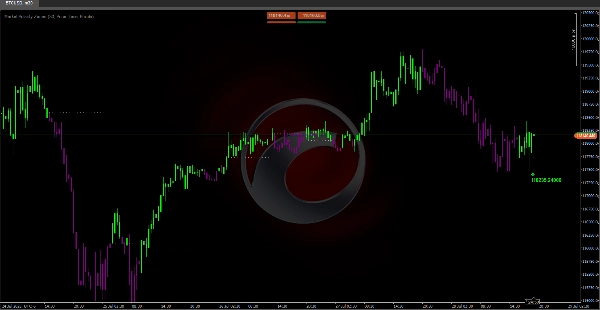
⚠️ Alertes de retournement :
Des étiquettes fléchées apparaissent lorsque des motifs spécifiques se forment :
- 🔻 Renversement baissier (étiquette violette) :
-
- Motif : Le prix monte → échoue → descend sous le niveau
- Signification : Pression haussière qui faiblit, possible basculement vers la zone baissière
- 🔺 Renversement haussier (étiquette verte) :
-
- Motif : Le prix baisse → rebondit → dépasse le niveau
- Signification : Les acheteurs défendent le niveau, possible basculement vers la zone haussière
ℹ️ Informations sur les étiquettes :
- "Prix" : Montre le point exact d’échec de la cassure – à utiliser pour des stops précis ou pour identifier des résistances/supports clés.
- "Volume" : Somme du volume des 3 dernières barres – confirme si le retournement a une vraie participation du marché.
Paramètres recommandés :
- Longueur : 33 (par défaut) – Fonctionne bien pour la plupart des marchés
- Données d’étiquette : "Prix" pour la précision du niveau, "Volume" pour la confirmation
- Couleurs : Gardez Lime/Violet pour un meilleur contraste visuel 🎨


![Logo de "[Stellar Strategies] Smart ADX"](https://cdn.ctrader.com/image/webp/af13b084-b6f6-41db-b7bc-c7e688b57b05_36929)


