
Tracking Performance by Quantara
Chỉ báo
44 lượt tải
Phiên bản 1.0, Feb 2026
Windows, Mac
Kể từ 29/01/2026
44
Cài đặt miễn phí
Mô tả
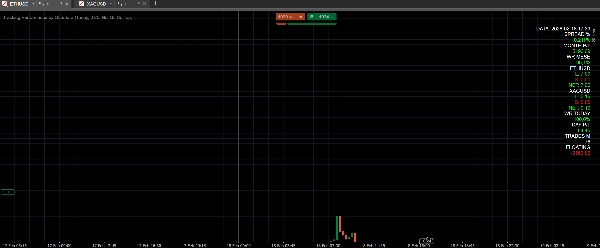
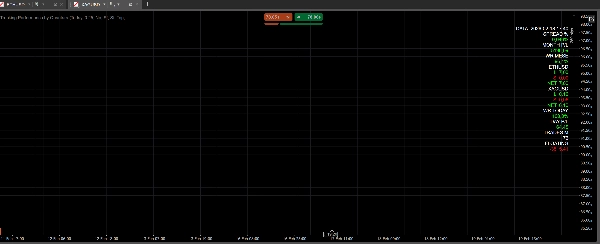
Tracking Perfromance by Quantara là một chỉ báo bảng điều khiển hiển thị các chỉ số hiệu suất theo thời gian thực và mức độ tiếp xúc theo từng tài sản.
Nó hiển thị: lợi nhuận/lỗ hàng tháng và hàng ngày, tỷ lệ thắng hàng tháng và hàng ngày, số lượng giao dịch hàng tháng, lợi nhuận/lỗ nổi, chênh lệch theo phần trăm, và dài/ngắn/ròng cho mỗi tài sản mở.
Tất cả các giá trị được mã màu để dễ đọc nhanh (lợi nhuận/lỗ dương/âm, ngưỡng tỷ lệ thắng, màu xanh cho dài, màu đỏ cho ngắn).
Những gì nó tính toán/hiển thị
- Chênh lệch % (với các ngưỡng khác nhau cho kim loại và tiền điện tử)
- Lợi nhuận/lỗ hàng tháng và hàng ngày
- Tỷ lệ thắng hàng tháng và hàng ngày
- Số lượng giao dịch hàng tháng
- Lợi nhuận/lỗ nổi
- Mức độ tiếp xúc theo từng tài sản (dài / ngắn / ròng)
Công cụ/khoảng thời gian được khuyến nghị
- Hoạt động trên bất kỳ công cụ nào và bất kỳ khoảng thời gian nào
- Được đề xuất trên các biểu đồ chính (M15–H4) để theo dõi hàng ngày
Cách sử dụng
- Thêm chỉ báo vào biểu đồ
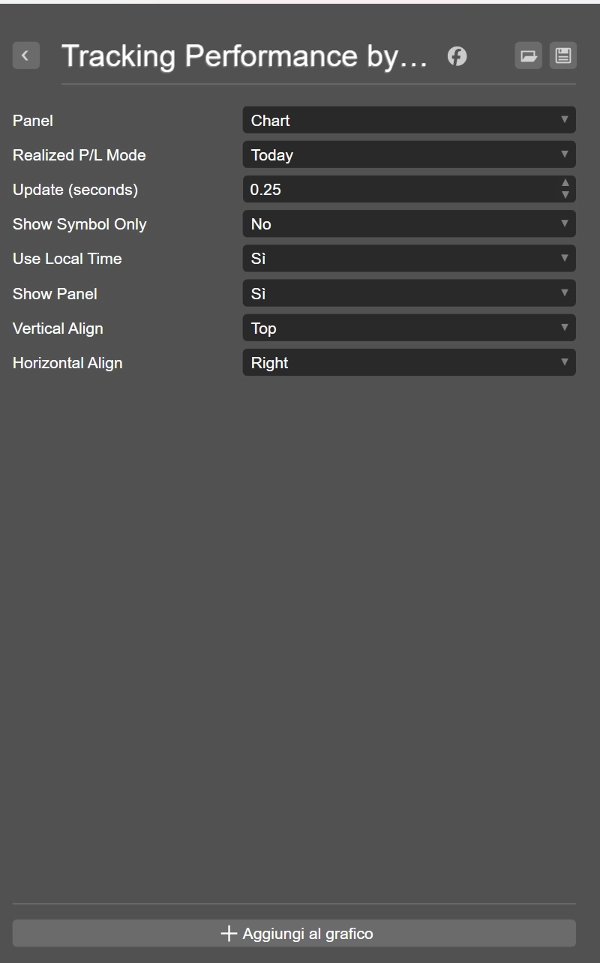
- Đặt khoảng thời gian cập nhật (Update seconds)
- Sử dụng Show Panel để bật/tắt hiển thị
- Sử dụng “Show Symbol Only” để lọc theo ký hiệu biểu đồ
- Sử dụng “Use Local Time” để áp dụng bộ lọc theo giờ địa phương
Các tham số chính
- Update (seconds): tần suất làm mới
- Show Symbol Only: chỉ hiển thị ký hiệu biểu đồ
- Use Local Time: sử dụng giờ địa phương cho bộ lọc
- Show Panel: hiển thị/ẩn bảng điều khiển
- Vertical/Horizontal Align: vị trí đặt bảng điều khiển
Các trường hợp sử dụng
- Kiểm tra nhanh mức độ tiếp xúc ròng theo từng tài sản
- Theo dõi hiệu suất hàng ngày và hàng tháng
- Giám sát tỷ lệ thắng để đảm bảo chất lượng vận hành
- Giám sát % chênh lệch cho kim loại và tiền điện tử
Tuyên bố từ chối trách nhiệm
Giao dịch có rủi ro. Hiệu suất trong quá khứ không đảm bảo kết quả trong tương lai.
Tóm tắt
AI summary
Tracking Performance by Quantara is a dashboard indicator designed for real-time monitoring of trading performance across multiple assets. It provides key metrics including monthly and daily profit and loss (P/L), win rate, trade count, floating P/L, and spread percentage, with specific thresholds for metals and cryptocurrencies. The indicator also displays per-asset exposure categorized as long, short, or net positions. All values are dynamically color-coded to facilitate quick interpretation, highlighting positive/negative P/L, win-rate levels, and position types.
This tool is compatible with any trading instrument and timeframe, with a recommendation for use on main charts ranging from 15-minute to 4-hour intervals for daily performance tracking. Users can customize update frequency, toggle panel visibility, filter data to the current chart symbol, and apply local time settings. The indicator supports quick assessment of net exposure, daily and monthly performance, win-rate monitoring, and spread percentage analysis for metals and crypto markets.
Key parameters include update interval, symbol filtering, local time usage, panel display options, and panel alignment. This indicator is applicable across Forex, Indices, Commodities, Crypto, and Stocks markets.
This tool is compatible with any trading instrument and timeframe, with a recommendation for use on main charts ranging from 15-minute to 4-hour intervals for daily performance tracking. Users can customize update frequency, toggle panel visibility, filter data to the current chart symbol, and apply local time settings. The indicator supports quick assessment of net exposure, daily and monthly performance, win-rate monitoring, and spread percentage analysis for metals and crypto markets.
Key parameters include update interval, symbol filtering, local time usage, panel display options, and panel alignment. This indicator is applicable across Forex, Indices, Commodities, Crypto, and Stocks markets.
Hồ sơ chỉ báo
Đánh giá của khách hàng
0.0
Đánh giá: 0
Đánh giá của khách hàng
Sản phẩm này chưa có đánh giá nào. Bạn đã dùng thử chưa? Hãy là người đầu tiên chia sẻ với mọi người!
Thảo luận
Câu hỏi thường gặp
Forex
Indices
Commodities
Crypto
Stocks
Các sản phẩm có sẵn trên cTrader Store, bao gồm bot giao dịch, chỉ báo và plugin, được cung cấp bởi các nhà phát triển bên thứ ba và chỉ nhằm mục đích cung cấp thông tin và tiếp cận kỹ thuật. cTrader Store không phải là nhà môi giới và không cung cấp lời khuyên đầu tư, khuyến nghị cá nhân hay bất kỳ đảm bảo nào về hiệu suất trong tương lai.
















Giá
Kể từ 29/01/2026
44
Cài đặt miễn phí