
Description
🚀 Plus de 10 000 traders utilisent déjà nos MEILLEURS indicateurs🏆
Découvrez pourquoi les professionnels nous choisissent – les outils les plus puissants sur cTrader (indicateurs, algorithmes et cBots) vous attendent.
👉 Obtenez tous nos MEILLEURS systèmes ici :
_______________________________________________
📌 Indicateurs de structure de marché
· ✅ AdvancedMarket Structure : Bos, Choch, SwinLevels, Order Blocks, Market Structure& Liquidity Finder
· 🔄 Analyse dynamique de la structure du marché des points de retournement
· 🧱 Order Block
· ⛓️ BOS & CHOCH
· 🧠 ICT Power of 3
· 🌀 Zones de polarité du marché
_______________________________________________
🔚 Systèmes de sortie intelligents
· 📍 Algorithme intelligent de suivi
_______________________________________________
📐 Indicateurs ZigZag
· 🔍 Projection de liquidité des prix ZigZag
· ➖ ZigZag
· 🎯 Suivi des extrémités Zig-Zag
_______________________________________________
🧱 Indicateurs de support et résistance
· 🟩 Lignes de support et résistance SmartTrend
· 🧱 Tous les niveaux de support et résistance
_______________________________________________
📊 Indicateurs de tendance et de canal
· 🔄 Canal de tendance automatique
· 📊 Supertrend
· ⚡Analyseur de tendance Momentum
· 🧠 Canal de tendance adaptatif
· 💥 Système de cassure de canal
· 🌈 Gradient de tendance dynamique
_______________________________________________
💧 Outils de volume et de liquidité
· 🔥 Carte thermique du POC de volume
· 📉 Carte de liquidation à effet de levier
· 🕒 Sessions de Fair Value Gap
_______________________________________________
⚡ Indicateurs Momentum & RSI
· 📈 Déclencheur de tendance RSI
· 🚀 Momentum de plage dynamique
· 🔎 Biais de chandelier multi-niveaux
Suivi
_______________________________________________
🔮 Outils de prédiction et de projection
· 📐 Prédiction basée sur Linreg & ATR
· 📏 Régression linéaire de Fibonacci multi-échelles
· 📈 Projecteur de flux de marché alimenté par le volume
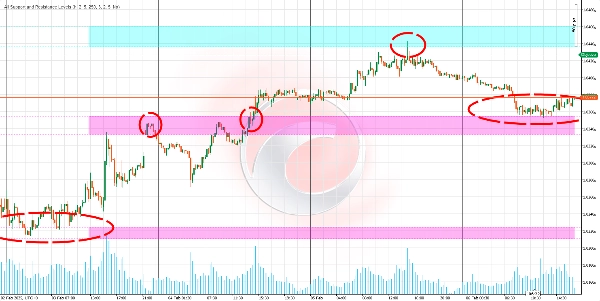
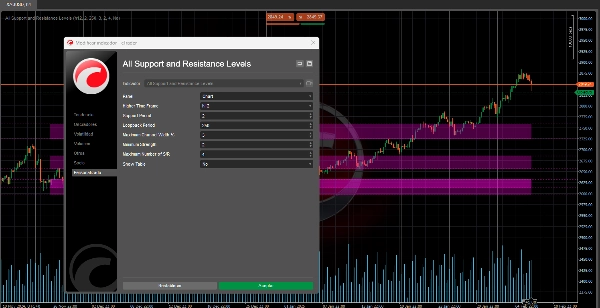
Cet algorithme est un indicateur avancé de support et résistance conçu pour vous aider à identifier les niveaux clés du marché.
Son principal avantage est qu’il vous permet de visualiser les niveaux de support et de résistance de n’importe quelle unité de temps (comme quotidien, hebdomadaire ou mensuel) directement sur le graphique que vous analysez, même s’il s’agit d’une unité de temps différente (par exemple, 15 minutes ou 1 heure). 📊⏰
À quoi ça sert ? 🎯
Identifier les zones clés du marché :
- Détecter les niveaux où le prix pourrait s’arrêter, rebondir ou casser avec force. 🛑↗️↘️
- Vous aide à prendre des décisions plus éclairées sur les entrées, sorties et stop-loss. 💡📈📉
Analyser plusieurs unités de temps sans changer de graphique :
- Voir les niveaux importants des unités de temps supérieures (comme quotidien ou hebdomadaire) tout en tradant sur des unités de temps inférieures (comme 15 minutes ou 1 heure). 🕒📅
- Vous offre une vue plus large du marché sans changer constamment de graphique. 🌍🔍
Prioriser les niveaux significatifs :
- L’indicateur classe les niveaux de support et résistance selon leur « force », c’est-à-dire la fréquence à laquelle le prix a interagi avec eux dans le passé. 💪📊
- Cela vous aide à vous concentrer sur les niveaux les plus pertinents et fiables. 🎯✅
Comment fonctionne la logique ? 🧠⚙️
Collecte de données :
- L’indicateur prend les prix hauts et bas d’une unité de temps spécifique (quotidien, hebdomadaire, etc.). 📈📉
- Ces données sont utilisées pour rechercher des motifs clés dans le comportement des prix. 🔍📊
Détection des points clés (pivots) :
- Il identifie les hauts et bas locaux — points où le prix a atteint un sommet ou une vallée par rapport aux prix environnants. ⛰️🌄
- Ces points sont des candidats pour devenir des niveaux de support ou résistance. 🎯📌
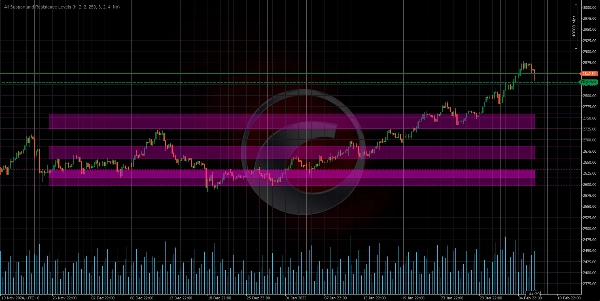
Regroupement des niveaux :
- Les niveaux proches sont regroupés pour former des zones de support ou résistance, plutôt que des lignes exactes. 🟦🟧
- Cela reflète l’idée que le support et la résistance sont des zones, pas des points précis. 📏🎯
Calcul de la force du niveau :
La « force » d’un niveau est déterminée par deux facteurs :
- Fréquence des touches : Combien de fois le prix a touché ou approché ce niveau dans le passé. 🔄📊
- Regroupement des points clés : Combien de hauts ou bas sont proches de ce niveau. 🔗📈
Les niveaux avec une plus grande force sont considérés comme plus significatifs. 💪🎯
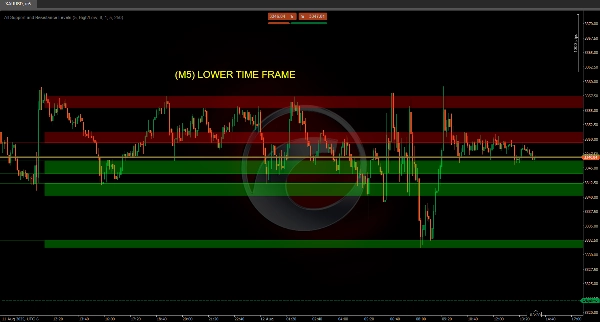
Visualisation sur le graphique :
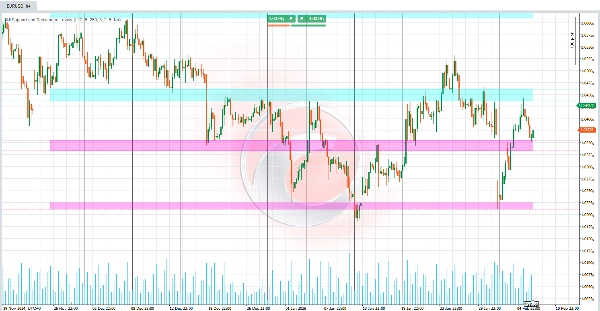
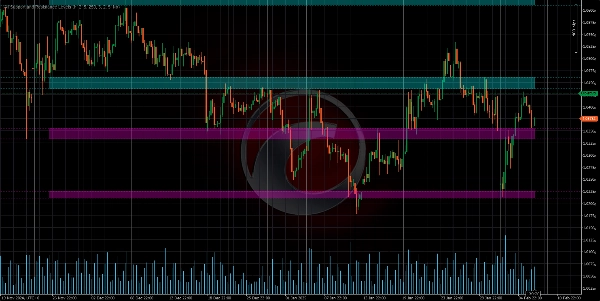
- Les niveaux sont dessinés sous forme de lignes horizontales ou de zones colorées sur le graphique. 🎨📊
- La couleur de chaque niveau dépend de la position actuelle du prix :
-
- Résistance : Si le prix est en dessous du niveau. 🔴
- Support : Si le prix est au-dessus du niveau. 🟢
- Dans la plage : Si le prix est à l’intérieur de la plage du niveau. 🟡
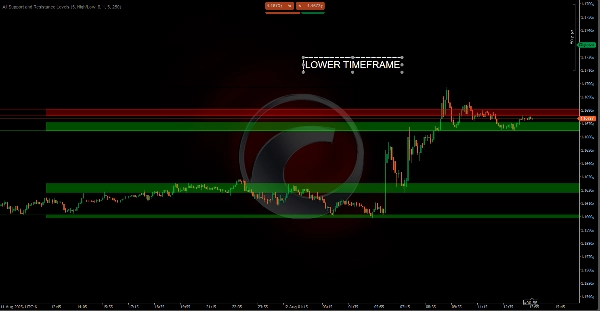
Comment pouvez-vous voir différentes unités de temps sur votre graphique ? 🕒📊
Support et résistance des unités de temps supérieures sur les graphiques d’unités de temps inférieures :
- Par exemple, si vous analysez un graphique de 15 minutes, l’indicateur peut afficher les niveaux clés de l’unité de temps quotidienne ou hebdomadaire. 🕒📅
- Cela vous permet de voir des niveaux importants dans un contexte supérieur sans quitter votre graphique actuel. 🌍🔍
Support et résistance des unités de temps inférieures sur les graphiques d’unités de temps supérieures :
- Bien que moins courant, vous pouvez également voir les niveaux des unités de temps plus petites (comme 1 minute ou 5 minutes) sur des graphiques d’unités de temps supérieures (comme quotidien ou hebdomadaire). 🕒📅
- Cela peut être utile pour une analyse plus détaillée dans un contexte plus large. 🔍📊
Résumé
The indicator analyzes price data by collecting highs and lows from specified timeframes, identifying local pivot points where price peaks or valleys occur. These points are grouped into zones representing support or resistance areas rather than precise lines. Each level is assigned a strength score based on the frequency of price touches and the clustering of key points, helping users prioritize the most significant and reliable levels.
Visualized on the chart as horizontal lines or colored zones, the indicator uses color coding to indicate the price's position relative to each level: red for resistance (price below level), green for support (price above level), and yellow when price is within the level’s range. This tool assists traders in making informed decisions on entries, exits, and stop-loss placements by highlighting where price may stop, bounce, or break with strength.
Avis clients
5 | 50 % | |
4 | 0 % | |
3 | 0 % | |
2 | 0 % | |
1 | 50 % |


