
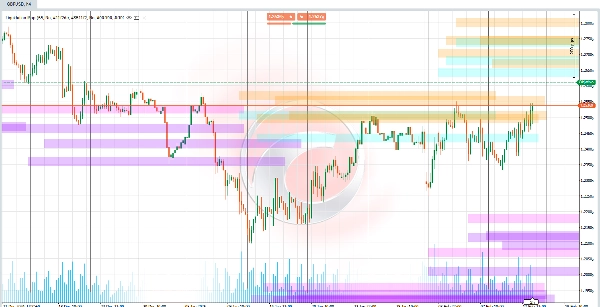
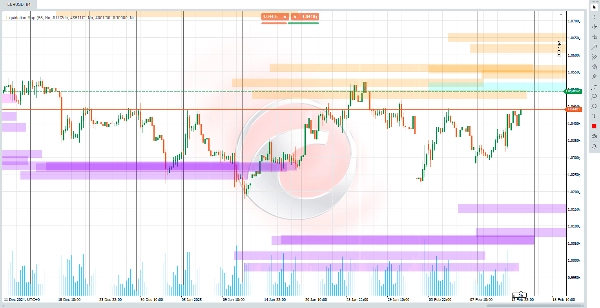
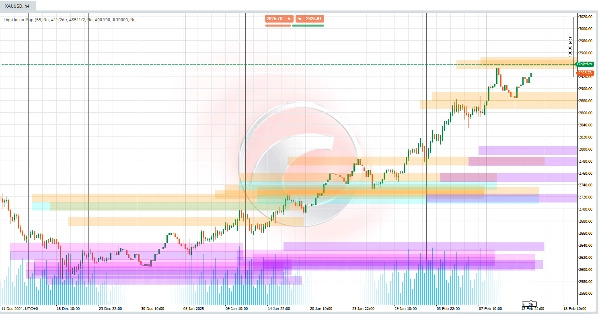
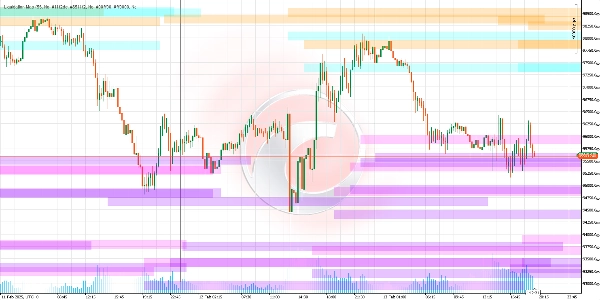
Leverage Liquidation Map
지표
5 구매
버전 1.0, Feb 2025
Windows, Mac
4.3
리뷰: 3
설명
🔍 특정 과거 기간 동안의 거래량 데이터를 분석하여, 고레버리지 투자자들이 청산될 가능성이 있는 영역을 강조하며, 시장 행동에 대한 귀중한 통찰을 제공합니다.
이 지표는 무엇을 하나요?
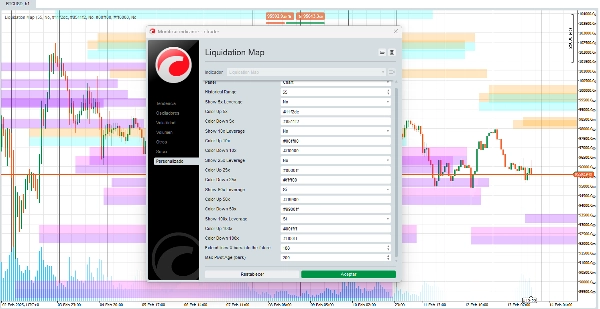
이 알고리즘은 대규모 청산 이 발생할 가능성이 높은 가격 수준을 식별합니다 (예: 5배, 10배, 25배, 50배, 또는 100배 레버리지). 이러한 수준은 청산이 급격한 시장 변동을 촉발할 수 있기 때문에 가격 움직임의 "자석" 역할을 합니다. 지표는 차트에 수평선을 그려 이러한 임계값을 나타내고, 미래의 주요 관심 구역을 예측합니다.
이 수준들은 어떻게 계산되나요?
- 가격 피벗 감지:
🔄 차트에서 최근 고점과 저점(가격이 방향을 바꾸는 지점)을 식별합니다. 이 피벗들이 청산 수준 계산의 기초가 됩니다. - 트리거로서의 거래량:
📊 현재 거래량을 과거 평균과 비교합니다. 거래량이 특정 임계값(예: 100배 레버리지의 경우 평균의 1.2배)을 초과하면 해당 청산 수준이 활성화됩니다. - 청산 공식:
레버리지가 높을수록 청산 수준은 현재 가격에 더 가깝게 설정됩니다. -
- 롱 포지션의 경우: 청산 수준은 피벗 저점보다 아래에 설정되며, 레버리지에 따라 계산됩니다 (예: 50배의 경우 2% 아래).
- 숏 포지션의 경우: 같은 원칙을 적용하여 피벗 고점보다 위에 설정됩니다.
사용 시 기대할 수 있는 점은?
- 유동성 라인: 🎨 청산으로 인해 시장이 높은 변동성을 경험할 수 있는 구역을 나타내는 사용자 정의 가능한 수평선을 볼 수 있습니다.
- 설정 가능한 레버리지: ⚙️ 각 레버리지 유형에 대해 수준을 활성화하거나 비활성화할 수 있습니다 (예: 50배와 100배에만 집중).
- 색상 맞춤화: 🌈 각 청산 범위에 대해 색상을 선택하여 시각화를 개인 취향에 맞게 조정할 수 있습니다.
- 혼잡 구역: 🎯 여러 선이 서로 가까이 있을 경우, 여러 청산이 동시에 발생할 수 있는 고위험/고수익 구역을 나타냅니다.
신호를 어떻게 해석하나요?
- 가격이 선에 접근할 때: 🚨 가격이 청산 수준에 가까워지면 (특히 거래량이 많을 때) 급격한 움직임 가능성이 높아집니다.
- 색상과 투명도: 🎨 색상은 레버리지에 따라 다릅니다 (예: 25배는 파란색, 50배는 주황색). 투명도는 관련 거래량의 "강도"를 나타냅니다 (진한 선 = 더 큰 거래량).
왜 유용한가요?
- 능동적 예측: 🔮 과거만 분석하는 것이 아니라 현재 상황을 바탕으로 미래 수준을 예측합니다.
- 시장 심리 집중: 🧠 강제 청산은 연쇄 반응을 일으키는 경우가 많습니다 (예: 손절 주문이 추가 매도를 촉발). 이 지표는 이를 미리 예측하는 데 도움을 줍니다.
- 맞춤화: 🛠️ 시각화를 전략에 맞게 조정할 수 있습니다 (예: 변동성이 큰 시장에서 높은 레버리지 우선).
고려해야 할 한계
- 거래량 의존성: 📉 거래량이 적거나 과거 데이터가 부족하면 신호의 신뢰도가 떨어질 수 있습니다.
- 예언의 구슬이 아님: 🔮 수준은 가능성 있는 구역을 나타내며 확실한 것은 아닙니다. 항상 다른 분석과 함께 사용하세요.
- 동적인 환경: 🌍 예상치 못한 뉴스가 있는 시장에서는 청산이 예측된 수준 밖에서 발생할 수 있습니다.
Ctrader Store 지표들:
Dynamic Market Structure
Analysis of Turning Points
Fibonacci Linear
Regression Multi-timeframe
Multi-Level Candle Bias
Tracker
Auto Support and
Resistance Trend Lines
요약
지표 프로필
고객 리뷰
4.3
리뷰: 3
5 | 67 % | |
4 | 0 % | |
3 | 33 % | |
2 | 0 % | |
1 | 0 % |
고객 리뷰
February 17, 2025
Patient signal check for traders who combine signals before acting. It gives value around chart reading, but it should not be used as a blind entry trigger. The cleaner reads should hold across 3 sessions, not just 1 good chart. It is stronger when a 1.5R target is realistic before the entry.
February 16, 2025
February 16, 2025
Realistic setup support for chart reading. it makes market context easier to scan, especially when used for adding confirmation before a trade. I would test it on 2 timeframes, 20 signals and a 1R stop plan. It is stronger when a 1.5R target is realistic before the entry.
상담
자주 묻는 질문(FAQ)
Breakout
Supertrend
RSI
트레이딩 봇, 지표, 플러그인 등 cTrader Store에서 제공되는 상품은 제3자 개발자에 의해 제공되며, 이는 단순히 정보 및 기술적 접근을 목적으로 제공된 것입니다. cTrader Store는 중개인이 아니며, 투자 조언, 개인별 추천 또는 향후 성과에 대한 어떠한 보장도 제공하지 않습니다.


!["Smart Money Concepts (SMC) [Iridio Capital]" 로고](https://cdn.ctrader.com/image/webp/28b69fd1-ef54-4bed-9487-07e78e883be4_40934)


가격
가입일 03/10/2024
163
판매
37.89K
무료 설치