
Описание
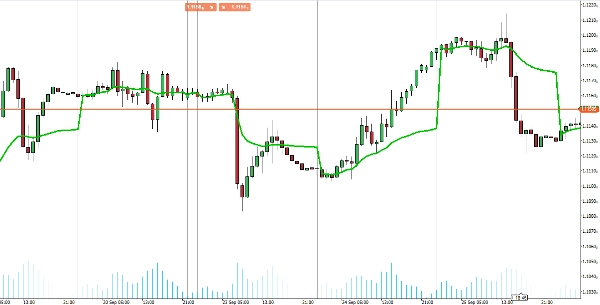
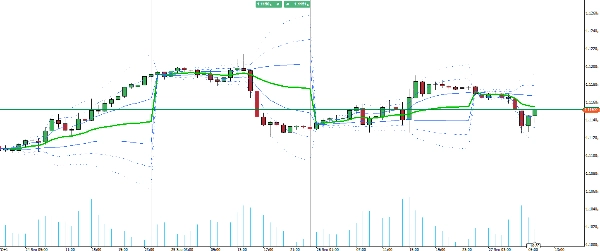
Представляем индикатор VWAP для cTrader, который приносит полную функциональность Volume Weighted Average Price от TradingView на вашу торговую платформу.
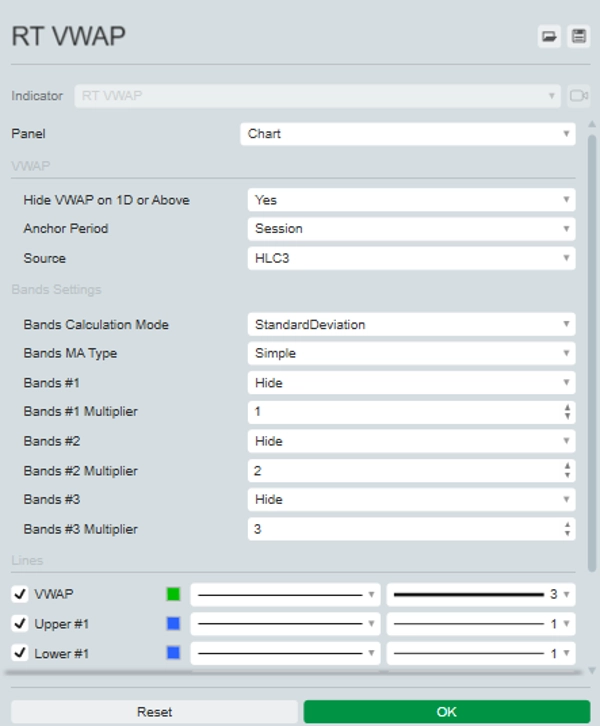
Этот комплексный инструмент позволяет выбирать период якоря (Сессия, Неделя, Месяц, Квартал, Год) и выбирать из различных источников цены, включая Open, High, Low, Close, HL2, HLC3, OHLC4 и HLCC4. Кроме того, он может отображать до трех стандартных отклонений верхних и нижних полос, обеспечивая полный обзор распределения цен.
Индикатор VWAP обновляется в реальном времени с данными тиков, гарантируя, что у вас есть самые точные и своевременные данные для принятия торговых решений. Повышайте свою торговую стратегию с помощью универсального и мощного индикатора VWAP в cTrader.
Сводка
Профиль индикатора
Отзывы покупателей
0.0
Отзывы: 0
Отзывы покупателей
У этого продукта еще нет отзывов. Уже попробовали его? Поделитесь впечатлениями!
Обсуждение
Частые вопросы
BTCUSD
Forex
Indices
EURUSD
Commodities
GBPUSD
NZDUSD
Scalping
Crypto
Stocks
XAUUSD
NAS100
USDJPY
VWAP
Продукты, доступные в cTrader Store, включая торговых ботов, индикаторы и плагины, предоставляются сторонними разработчиками и доступны исключительно в информационных и технических целях. cTrader Store не является брокером и не предоставляет инвестиционные консультации, персональные рекомендации или какие-либо гарантии будущей доходности.


Цена
С 25/09/2024
20
Продажи