
Tsunami Volume Surge - RVOL
지표
2 구매
버전 1.0, Sep 2025
Windows, Mac
4.6
리뷰: 3
설명
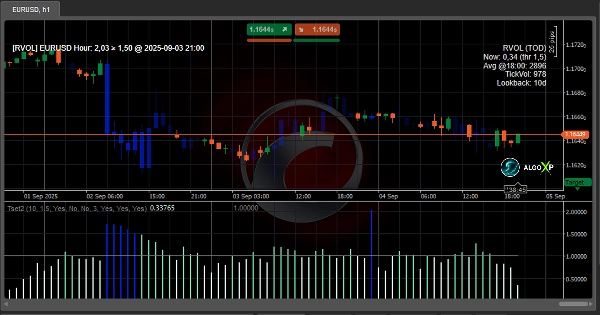
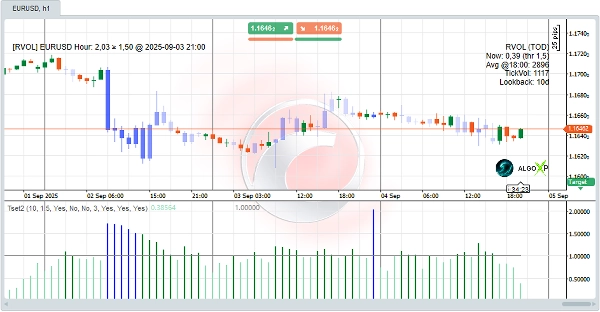
🌊 쓰나미 거래량 급증 (RVOL + 시간대) 은 cTrader용 정밀 거래량 도구로, 시장이 진정으로 활발할 때를 보여줍니다.
원시 거래량을 보는 대신, 쓰나미는 각 봉의 활동을 선택한 Lookback Days 동안 같은 시간대의 평균과 비교합니다. 이 시간대 정규화는 실제 참여 급증을 드러내어 거래할 수 있게 합니다: 1.0을 “정상”으로 간주하고, 1.5–2.0을 돌파 확인에 사용하며, 3.0+는 폭발적인 뉴스 움직임을 주시하세요. 깔끔한 RVOL 히스토그램, 동적 캔들 색상, 그리고 알림 및 팝업은 한눈에 에너지를 명확히 보여줍니다 - FX, 암호화폐, 지수 전반의 M1–M15에서 가볍고 빠릅니다. RVOL 값은 또한 cBots에 간단하고 견고한 필터로 활용할 수 있습니다.
자세한 FAQ와 더 많은 자료는 AlgoXP 에서 확인하세요.
⚡ 사용 방법 (빠른 시작)
- 차트에 쓰나미 추가 (M1–M15가 적합). Lookback Days 설정 (처음에는 20–30부터 시작).
- 기준선 1.0 유지. RVOL < 1.0 = 조용함; ≥ 1.5–2.0 = 돌파 확인; ≥ 3.0 = 뉴스 급증.
- 알림 활성화 Enable Alerts 후 Alert On Close Only (안전) 또는 인트라바 (빠름) 선택.
- 에너지 즉시 확인을 위해 Colorize Bars 사용; 원하는 대로 Bar Color 조정.
- (선택 사항) cBots에서 RVOL 시리즈를 읽어 활성 신호만 필터링.
🚀 결과: 쓰나미는 거래량을 시간 인지 우위로 바꿔, 비활성 기간을 건너뛰고, 진짜 돌파를 확인하며, 시장이 깨어날 때 더 빠르게 반응할 수 있게 도와줍니다.
요약
AI 요약
Tsunami Volume Surge - RVOL is a volume indicator designed for the cTrader platform that measures Relative Volume (RVOL) normalized by time-of-day. Instead of using raw volume data, it compares each bar’s volume to the average volume at the same time over a user-defined lookback period, highlighting genuine spikes in market participation. This approach helps traders identify when the market is truly active, distinguishing normal volume (RVOL around 1.0) from breakout confirmations (1.5–2.0) and explosive news-driven moves (3.0+).
Key features include an RVOL histogram, dynamic candle coloring for quick visual assessment, and customizable alerts with pop-ups. It operates efficiently on short timeframes (M1 to M15) and supports multiple markets such as Forex, cryptocurrencies, indices, commodities, and stocks. Additionally, RVOL values can be integrated into cBots as filters to refine automated trading signals.
The indicator aims to provide a time-aware volume edge, enabling traders to avoid low-activity periods, confirm breakouts, and respond promptly to market surges. Users can adjust settings like lookback days, alert preferences, and bar colors to tailor the tool to their trading style.
지표 프로필
고객 리뷰
4.6
리뷰: 3
5 | 67 % | |
4 | 33 % | |
3 | 0 % | |
2 | 0 % | |
1 | 0 % |
고객 리뷰
September 21, 2025
one green trade proves nothing. Low confidence trades are easier to notice.
September 20, 2025
상담
자주 묻는 질문(FAQ)
BTCUSD
Forex
Indices
EURUSD
Commodities
GBPUSD
NZDUSD
Prop
Crypto
Stocks
XAUUSD
NAS100
USDJPY
트레이딩 봇, 지표, 플러그인 등 cTrader Store에서 제공되는 상품은 제3자 개발자에 의해 제공되며, 이는 단순히 정보 및 기술적 접근을 목적으로 제공된 것입니다. cTrader Store는 중개인이 아니며, 투자 조언, 개인별 추천 또는 향후 성과에 대한 어떠한 보장도 제공하지 않습니다.


가격
가입일 13/08/2025
444
판매
4.73K
무료 설치