
Description
Indicateurs du magasin Pinescriptlabs : cBots du magasin Pinescriptlabs : (cBot) Gold & BTC BreakoutSession Pivots(nouveau)
Projection de liquidité du prix ZigZag
Algorithme intelligent de suivi (nouveau)
Carte de liquidation de levier
Prédiction basée sur Linreg & ATR
Support SmartTrend &
Résistance
Lignes
Sessions de gap de valeur équitable
Analyse
dynamique de la structure
du marché
des
points
de retournement
Régression
linéaire
de Fibonacci
multi-échelle
Gap de valeur équitable de momentum
Gradient de tendance dynamique
Suivi
du biais
multi-niveaux de chandeliers
Support
et résistance
automatiques
de tendance
Lignes
Tous
les supports et
résistances
Niveaux
Momentum de la plage dynamique
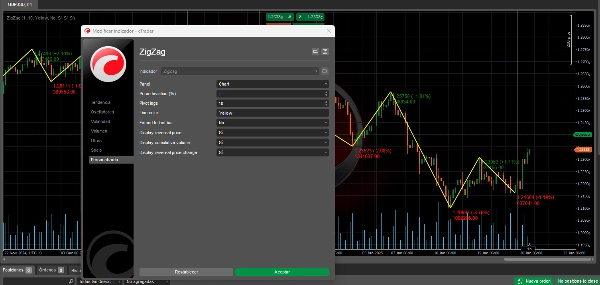
L'indicateur ZigZag : Simplifier les tendances du marché 📉📈
Le ZigZag est un indicateur technique qui aide à identifier les changements de tendance significatifs d'un actif en filtrant les mouvements mineurs du marché. Son objectif principal est de simplifier l'analyse visuelle des prix en éliminant le "bruit" des petites fluctuations.
Comment ça fonctionne ⚙️
- 📊 Analyse les prix pour trouver des points de retournement significatifs (pivots).
- 📈 Un point de retournement est considéré comme significatif lorsque le prix change d'un pourcentage minimum spécifique (paramètre de déviation).
- 🔗 Relie ces points de retournement par des lignes droites, formant un motif "zigzag".
- 🕒 Se met à jour dynamiquement à mesure que de nouvelles données de prix apparaissent.
Utilité pour le trading 💡
Identification de tendance 📐
- 🔍 Aide à visualiser la direction principale du marché.
- 🚀 Facilite la détection des tendances haussières et baissières.
- 📏 Met clairement en évidence les niveaux clés de support et de résistance.
Analyse des motifs 📋
- 🎯 Simplifie l'identification des motifs graphiques.
- 🕵️♂️ Met en évidence les formations de prix comme les triangles, les drapeaux et autres motifs.
- 🌊 Améliore la clarté lors de la reconnaissance des vagues d'Elliott.
Gestion des trades 🎛️
- 🎯 Identifie les points d'entrée et de sortie potentiels.
- 🛡️ Aide à déterminer les niveaux de stop-loss basés sur les pivots précédents.
- 🎯 Facilite la définition d'objectifs de prix réalistes.
Analyse de la volatilité 🌡️
- 📏 La distance entre les pivots reflète la volatilité du marché.
- 🧩 Aide à ajuster les stratégies en fonction de l'ampleur des mouvements.
- ⏳ Distingue les périodes de consolidation des tendances directionnelles.
Confirmation du signal ✅
- 🔍 Sert d'outil de confirmation pour d'autres indicateurs.
- 🚪 Valide les cassures des niveaux clés.
- 🔗 Peut être combiné avec d'autres indicateurs pour des stratégies plus robustes.
Considérations clés 🧠
C'est rétrospectif 📅
- ⏪ Les points pivots ne sont confirmés qu'après que le mouvement se soit produit.
- 🔮 Ce n'est pas prédictif en soi.
- ⚖️ Doit être utilisé en combinaison avec d'autres indicateurs pour la prise de décision.
Ajustements des paramètres 🔧
- 🎚️ La sensibilité dépend du pourcentage de déviation défini.
- 🔍 Un pourcentage plus petit montre plus de points pivots.
- 🧹 Un pourcentage plus élevé filtre les mouvements mineurs, ne montrant que les changements significatifs.
Utilisation de l'échelle de temps 🕒
- 🕰️ Fonctionne sur n'importe quelle échelle de temps.
- 🔄 Les paramètres doivent être ajustés en fonction des horizons de trading.
- 🌐 L'analyse sur plusieurs échelles de temps offre une vue plus complète.
📈 Utilisez l'indicateur ZigZag comme un outil puissant pour simplifier l'analyse, identifier les tendances et améliorer la prise de décision dans votre parcours de trading ! 🚀
Résumé
Key functionalities include:
- Trend Identification: Visualizes primary market direction, highlights bullish and bearish trends, and marks key support and resistance levels.
- Pattern Analysis: Simplifies recognition of chart patterns such as triangles, flags, and Elliott waves.
- Trade Management: Assists in identifying entry and exit points, setting stop-loss levels based on previous pivots, and establishing realistic price targets.
- Volatility Analysis: Reflects market volatility through pivot distances, aiding strategy adjustments and distinguishing consolidation from trending phases.
- Signal Confirmation: Validates breakouts and complements other indicators for robust trading strategies.
The indicator is retrospective, confirming pivots only after price movements occur, and is not predictive on its own. Sensitivity can be adjusted via the deviation percentage to show more or fewer pivot points. It is compatible with any timeframe and benefits from multi-timeframe analysis for comprehensive market views.
This tool supports analysis across various markets including cryptocurrencies (BTCUSD), commodities (XAUUSD), and others, and integrates with related indicators like RSI, ATR, and Supertrend.
Avis clients
5 | 50 % | |
4 | 33 % | |
3 | 17 % | |
2 | 0 % | |
1 | 0 % |


