Description
Indicateurs du magasin Pinescriptlabs : 🤖Pinescriptlabs Store cBots : (cBot) Gold & BTC BreakoutSession Pivots(nouveau)
Carte de liquidation de levier
Prédiction basée sur Linreg & ATR
Support &
Résistance SmartTrend
Lignes
Analyse
de la structure
du marché
d
es points
de retournement
Régression
linéaire
de Fibonacci
Multi-échelle
Gradient de tendance dynamique
Suivi
du biais
multi-niveaux de chandeliers
Support
et résistance
automatiques
de tendance
Lignes
Tous
les niveaux
de support et résistance
Niveaux
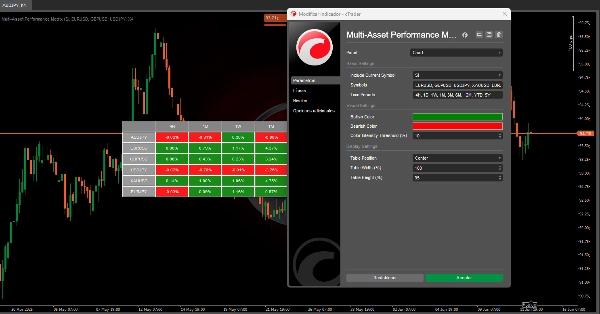
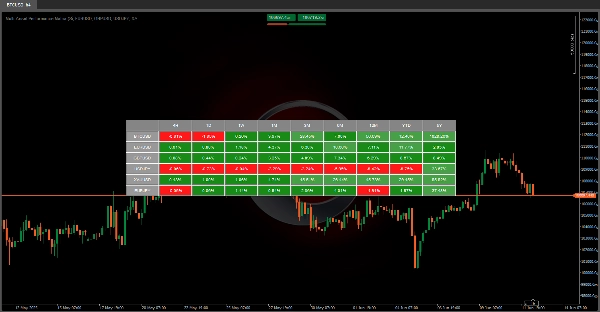
🚀 MATRICE DE PERFORMANCE MULTI-ACTIFS 🚀
Cet algorithme est un outil visuel puissant 📊 conçu pour afficher la performance en pourcentage de plusieurs instruments financiers sur différentes périodes.
Il transforme les données historiques en une visualisation efficace et intuitive, permettant aux utilisateurs d'évaluer rapidement le comportement de divers actifs financiers.
❓ Que fait cet outil ?
1️⃣ 📈 Compare les actifs : Montre comment les prix de différents instruments financiers (comme BTCUSD, EURUSD, XAUUSD, etc.) ont évolué au fil du temps.
- Périodes : D (quotidien) | 1S (hebdomadaire) | 1M (mensuel) | 3M (trimestriel) | 6M (semi-annuel) | 12M (annuel) | YTD (depuis le début de l'année) | 5A (5 dernières années)
2️⃣ 🎨 Met en évidence les tendances : Utilise un code couleur (🟢, 🔴 ) pour identifier instantanément quels actifs montent ou descendent à chaque période.
3️⃣ ⏱️ Mises à jour automatiques : Actualise les données toutes les minutes pour refléter les dernières informations du marché.
💡 Pourquoi est-ce utile ?
✔ 📊 Analyse comparative : Permet des comparaisons côte à côte de plusieurs actifs — idéal pour la gestion de portefeuille ou la sélection des actifs les plus performants selon les horizons temporels.
✔ 🛡️ Contrôle : Évaluer la constance (ou volatilité) d'un actif sur différentes périodes aide à évaluer les risques associés.
✨ Clé
✅ ⏳ Gain de temps : Collecter et calculer manuellement ces données prendrait des heures—cet outil le fait instantanément !
✅ 👀 Visuellement clair : Le système codé par couleur rend l'analyse facile, même pour les utilisateurs non techniques.
✅ 🔄 Adaptable : Prend en charge les symboles personnalisés, vous permettant de suivre les actifs qui comptent pour vous.
Résumé
Avis clients
5 | 100 % | |
4 | 0 % | |
3 | 0 % | |
2 | 0 % | |
1 | 0 % |