
Description
Pinescritlabs
Indicateurs du Ctrader Store : 🤖Pinescritlabs cBots du Ctrader Store :
Fair Value Gap Sessions Gold & BTC Breakout Session Pivots(nouveau)
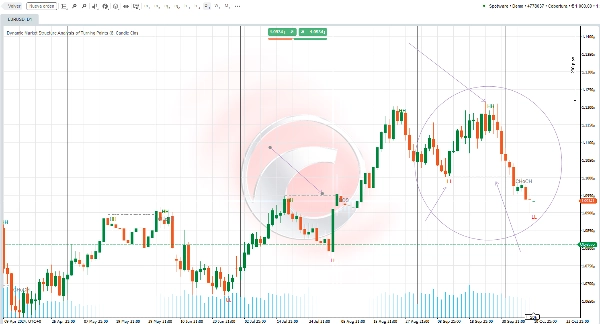
Dynamic Market Structure
Analyse des points de retournement
Fibonacci Linear
Régression multi-échelle
Multi-Level Candle Bias
Tracker
Auto Support and
Resistance Trend Lines
All Support and
Resistance Levels
Aperçu des paramètres de l'indicateur 🌟
LONGUEUR DU SWING 📏
Ce paramètre détermine combien de barres sont prises en compte à gauche et à droite lors de la recherche des points de swing. Une valeur plus basse affichera plus de points, tandis qu'une valeur plus élevée réduira leur quantité. Il est recommandé d'ajuster ce paramètre en fonction de votre style de trading et lors du passage entre différentes périodes.
CHOCH 🔄
L'activation de cette option renommera la première cassure contre-tendance en CHoCH (Change of Character), indiquant ainsi un possible changement de direction du marché.
HH et LL 📈📉
L'indicateur tracera les points hauts de swing (HH) et les points bas de swing (LL) sur le graphique, vous permettant de visualiser plus efficacement la structure du marché.
BOS ⚡
L'indicateur affichera également les niveaux de Break of Structure (BOS) lors de la détection de cassures aux points de swing, fournissant des informations supplémentaires sur la dynamique du marché.
Résumé
Avis clients
5 | 33 % | |
4 | 67 % | |
3 | 0 % | |
2 | 0 % | |
1 | 0 % |


