
Description
Ordre de Cluster de Liquidité (LCO) 🔍💧
1. Ce que montre le LCO
Ordre de Cluster de Liquidité détecte et trace automatiquement :
- Clusters de liquidité haussiers (zones potentielles de demande / accumulation) ✅
- Clusters de liquidité baissiers (zones potentielles d'offre / distribution) 🔻
Chaque cluster est :
- ancré sur une barre pivot de volume (un maximum local de volume),
- classé comme haussier ou baissier selon l'extension récente du prix,
- étendu dans le temps jusqu'à ce que le prix mitige (consomme) le cluster.
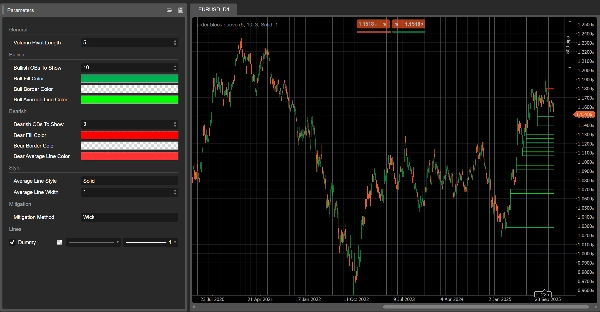
Sur le graphique, vous voyez :
- Rectangles verts → clusters de liquidité haussiers
- Rectangles rouges → clusters de liquidité baissiers
- Une ligne grise à l'intérieur de chaque rectangle → le niveau de prix moyen de ce cluster
Une fois qu'un cluster est considéré comme mitigé, il disparaît du graphique et seuls les clusters actifs restent.
2. Logique de détection (en termes simples)
- Pivot de volume
-
- LCO recherche des barres où le volume est plus élevé que les
Volume Pivot Lengthbarres précédentes et suivantes. - Ces barres sont des pivots de volume – ancres potentielles pour les clusters de liquidité.
- LCO recherche des barres où le volume est plus élevé que les
- Contexte : haussier vs baissier
-
- Le comportement récent du prix définit un contexte :
-
- Contexte haussier → l'extension à la baisse a dominé.
- Contexte baissier → l'extension à la hausse a dominé.
- Ce contexte décide si le prochain pivot de volume créera un cluster haussier ou cluster baissier de liquidité.
- Cluster de liquidité haussier
Dans un contexte haussier : -
- Bas du cluster = plus bas de la barre pivot
- Haut du cluster = point médian de la barre (
(haut + bas) / 2) - Interprétation : zone où la pression à la baisse a été absorbée et où les acheteurs sont intervenus agressivement.
- Cluster de liquidité baissier
Dans un contexte baissier : -
- Bas du cluster = point médian de la barre pivot
- Haut du cluster = plus haut de la barre pivot
- Interprétation : zone où la pression à la hausse a été absorbée et où les vendeurs ont pris le contrôle.
- Ligne moyenne
-
- Pour chaque cluster, LCO calcule la moyenne du haut et du bas et trace une ligne médiane grise.
- Celle-ci agit comme un niveau d'équilibre interne du cluster.
- Mitigation (consommation du cluster)
À chaque nouvelle barre, LCO vérifie si un cluster est mitigé : -
- Pour les clusters haussiers :
-
- Il suit un prix cible à la baisse sur les
Volume Pivot Lengthdernières barres : -
Méthode de mitigation = Mèche→ plus bas.Méthode de mitigation = Clôture→ plus bas à la clôture.
- Si ce prix cible descend en dessous du bas du cluster, le cluster haussier est considéré comme mitigé et supprimé.
- Il suit un prix cible à la baisse sur les
- Pour les clusters baissiers :
-
- Il suit un prix cible à la hausse :
-
Mèche→ plus haut.Clôture→ plus haut à la clôture.
- Si ce prix cible dépasse le haut du cluster, le cluster baissier est mitigé et supprimé.
Mitigé = la liquidité dans ce cluster est supposée consommée / invalidée.
3. Comment lire le LCO sur le graphique
Vous verrez principalement :
- Clusters verts sous le prix → zones potentielles de liquidité de demande
- Clusters rouges au-dessus du prix → zones potentielles de liquidité d'offre
Lecture typique (pas un conseil de trading) :
- Clusters récents
-
- Les clusters récemment créés sont souvent plus pertinents :
-
- Cluster haussier sous le prix → zone où les acheteurs ont absorbé la pression de vente en dernier.
- Cluster baissier au-dessus du prix → zone où les vendeurs ont absorbé la pression d'achat en dernier.
- Retests d'un cluster
-
- Le prix revient à un cluster haussier par le haut :
-
- Si le prix réagit et tient le bas → possible rebond / zone de réaction longue.
- Le prix revient à un cluster baissier par le bas :
-
- Si le prix ne parvient pas à dépasser le haut → possible rejet / zone de réaction courte.
- Clusters mitigés vs actifs
-
- Quand le prix traverse un cluster au-delà de ses limites selon la méthode de mitigation choisie,
→ ce cluster de liquidité est supprimé sur les barres suivantes. - Les clusters encore visibles sont des zones de liquidité actives pas encore totalement traversées.
- Quand le prix traverse un cluster au-delà de ses limites selon la méthode de mitigation choisie,
- Utilisation de la ligne médiane
-
- Cette ligne médiane grise peut être utilisée comme :
-
- un niveau de prise de profit ou de sortie partielle à l'intérieur du cluster,
- une référence de “prix équitable” dans la zone de liquidité,
- un moyen rapide de voir si le prix se négocie dans la moitié supérieure ou inférieure du cluster.
4. Paramètres (Anglais)
Volume Pivot Length
- Barres utilisées pour :
-
- détecter les pivots de volume,
- calculer les extrêmes et la cible de mitigation.
- Valeurs plus basses → plus de clusters, plus de bruit ;
- Valeurs plus élevées → moins de clusters, plus significatifs.
Clusters de liquidité haussiers à afficher
(anciennement OBs haussiers à afficher)
- Nombre maximum de clusters haussiers affichés sur le graphique.
Clusters de liquidité baissiers à afficher
(anciennement OBs baissiers à afficher)
- Nombre maximum de clusters baissiers affichés.
Couleur de remplissage haussier / baissier
- Couleur de remplissage des clusters haussiers/baissiers.
- Vous pouvez inclure des valeurs alpha (opacité).
Couleur de la ligne moyenne haussier/baissier
- Couleur de la ligne médiane interne pour chaque cluster.
Style de la ligne moyenne
- Style visuel pour la ligne médiane :
"Solide","Tiretée","Pointillée".
Largeur de la ligne moyenne
- Épaisseur de la ligne médiane.
Méthode de mitigation
"Mèche"→ mitigation basée sur les mèches haut/bas (plus sensible)."Clôture"→ mitigation basée sur les prix de clôture (plus conservatrice).
Résumé
On the chart, bullish clusters appear as green rectangles below the price, indicating areas where buyers absorbed selling pressure. Bearish clusters are shown as red rectangles above the price, marking zones where sellers absorbed buying pressure. Each cluster includes a grey mid-line representing the average price level, serving as an internal equilibrium reference.
Clusters extend forward in time until price "mitigates" or consumes them, at which point they disappear, leaving only active liquidity zones visible. Mitigation is determined by tracking price extremes (high/low wicks or closing prices) over a configurable number of bars.
Key parameters include the volume pivot length (defining sensitivity and cluster significance), maximum clusters displayed, cluster colors, mid-line style, and mitigation method. LCO supports various markets including forex, indices, commodities, stocks, and cryptocurrencies, and integrates with multiple trading strategies and indicators such as RSI, MACD, Bollinger Bands, and Fibonacci levels.
Avis clients
5 | 100 % | |
4 | 0 % | |
3 | 0 % | |
2 | 0 % | |
1 | 0 % |


