
Description
La boîte à outils Support & Résistance est un indicateur d'analyse de la structure du marché complet conçu pour aider les traders à identifier des zones de support et de résistance à haute probabilité sur les graphiques. En combinant plusieurs algorithmes avancés de détection de points pivots avec des zones de volatilité adaptatives, des filtres de flux monétaires institutionnels et une analyse de la liquidité, cette boîte à outils transforme les lignes traditionnelles de support et de résistance en un outil stratégique basé sur les données.
Détection
Cette boîte à outils comprend quatre méthodologies de détection avancées conçues pour s'adapter à différents styles de trading et environnements de marché :
- Pivots : L'approche classique de détection des supports et résistances utilisant des forces de retour configurables à gauche et à droite pour détecter les hauts et bas locaux.
- Donchian : Un algorithme à machine d'état haute performance qui détecte des structures de balancement alternées. Plutôt que d'utiliser un retard fixe, il confirme les extrêmes lorsque le marché change d'état directionnel.
- CSID : Une méthode de détection basée sur le momentum qui identifie les points de retournement structurels basés sur des chandeliers haussiers ou baissiers consécutifs, mettant en évidence des zones d'initiation de tendance fortes.
- ZigZag : Un algorithme basé sur la volatilité qui filtre les fluctuations mineures des prix en exigeant une déviation minimale en pourcentage avant d'identifier un balancement.
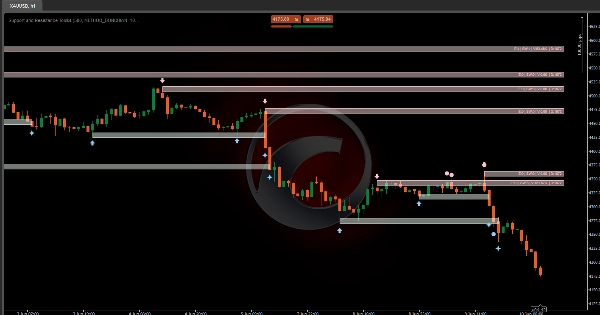
Zone / Niveau
Contrairement aux indicateurs conventionnels qui dessinent simplement des lignes fixes, cet outil traite les niveaux de support et de résistance comme des zones de prix dynamiques basées sur les caractéristiques suivantes :
- Profondeur de la zone (Multiplicateur ATR) : Détermine l'épaisseur de chaque zone en fonction de la plage vraie moyenne. Cela permet aux zones de s'adapter automatiquement à la volatilité du marché.
- Tampon de cassure (Multiplicateur ATR) : Un tampon de sécurité unique qui étend la zone au-delà du côté de la cassure. Le prix doit dépasser cette couche supplémentaire de volatilité avant que l'indicateur ne confirme une cassure, réduisant ainsi les faux signaux et les fausses cassures.
Filtrage & Visibilité :
- Fusion des zones chevauchantes : Combine les zones intersectées en une plus grande « Super Zone » qui représente toute la plage d'interaction historique.
- Masquer les plus anciennes en premier : Priorise la structure de marché récente en cachant les zones plus anciennes lorsqu'un chevauchement se produit.
- Masquer les plus jeunes en premier : Préserve les structures historiques établies en ignorant les petites nouvelles zones qui apparaissent dans les plages existantes.
Filtrage des niveaux ( E : Entrées | S : Force | SW : Balayages | V : Volume | D : Durée )
- Entrées de prix (E) : Exige qu'un niveau soit retesté un nombre spécifié de fois avant d'apparaître sur le graphique.
- Balayages (SW) : Détecte les pièges de liquidité où le prix viole brièvement un niveau avec une mèche mais clôture à l'intérieur de la zone.
- Volume échangé (V) : Suit le volume total échangé pendant que le prix interagit avec la zone, mettant en évidence la participation institutionnelle.
- Durée (D) : Exige que les zones survivent un nombre minimum de barres avant d'être considérées comme des niveaux structurels valides.
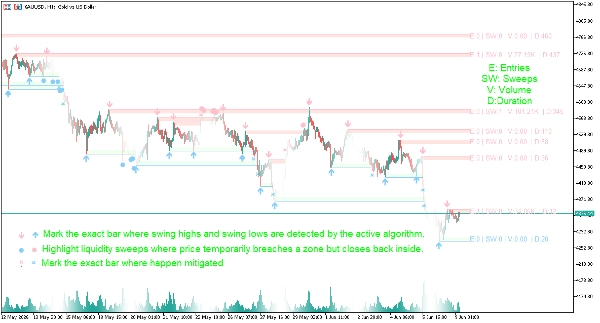
Signaux visuels
- ⬆/⬇ Flèches : Marquent la barre exacte où les hauts et bas de balancement sont détectés par l'algorithme actif.
- ● Gros points : Mettent en évidence les balayages de liquidité où le prix franchit temporairement une zone mais clôture à l'intérieur.
- ✖ Croix : Marquent la barre exacte où les hauts et bas de balancement sont migrés.
- Étiquettes récapitulatives : Chaque zone d'affichage présente une étiquette de données concise incluant les paramètres E (Entrées), S (Force), SW (Balayages), V (Volume) et D (Durée), permettant aux utilisateurs d'évaluer rapidement la qualité structurelle.
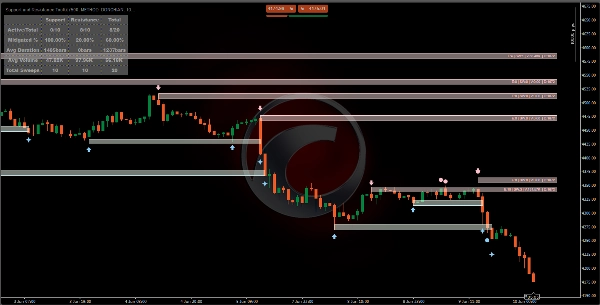
Tableau de bord
- Actif / Total : Affiche combien de structures sont actuellement actives par rapport au total détecté historiquement.
- % de mitigation : Mesure la fréquence à laquelle les niveaux sont cassés ou atténués, fournissant un aperçu de la fiabilité de la structure du marché.
- Durée moyenne : Le nombre moyen de barres pendant lesquelles une zone de support ou de résistance survit avant d'être cassée.
- Volume moyen : Indique la participation institutionnelle moyenne dans les zones avant qu'une cassure ne se produise.
- Total des balayages : Suit le comportement de chasse à la liquidité sur le marché.
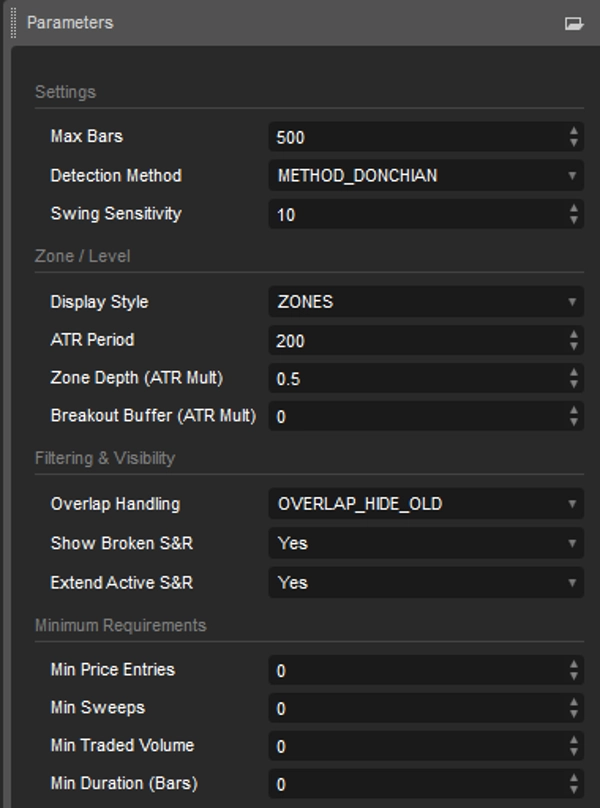
Paramètres de l'indicateur
Paramètres de détection
- Méthode de détection : Sélectionnez entre la détection de balancement Pivots, Donchian, CSID ou ZigZag.
- Sensibilité du balancement : Ajuste la déviation requise ou la longueur de retour nécessaire pour confirmer les hauts et bas de balancement.
Configuration de la zone & du niveau
- Style d'affichage : Basculez entre des lignes précises de support et résistance horizontales ou des zones basées sur l'ATR.
- Période ATR : Détermine la période de volatilité utilisée pour les calculs de zone.
- Profondeur de la zone (Multiplicateur ATR) : Ajuste l'épaisseur des zones de support et de résistance.
- Tampon de cassure (Multiplicateur ATR) : Ajoute un tampon de volatilité pour filtrer les fausses cassures.
Visibilité du graphique & Contrôle de la structure
- Gestion des chevauchements : Choisissez comment les zones chevauchantes sont gérées (Fusionner, Masquer les plus anciennes ou Masquer les plus jeunes).
- Max actif (non atténué) : Limite le nombre de zones de support et résistance actives affichées sur le graphique.
- Afficher S&R cassés : Activez ou désactivez la visibilité des niveaux cassés pour l'analyse historique.
- Étendre S&R actifs : Projette les niveaux actifs dans les barres de prix futures.
Exigences structurelles minimales
- Entrées de prix minimales : Définit le nombre requis de retests avant qu'un niveau devienne visible.
- Balayages minimaux : Exige un certain nombre de balayages de liquidité avant d'afficher la zone.
- Volume échangé minimal : Assure que les zones atteignent un seuil minimum de participation institutionnelle.
- Durée minimale (barres) : Exige que les niveaux existent pendant un nombre spécifié de barres avant d'apparaître.
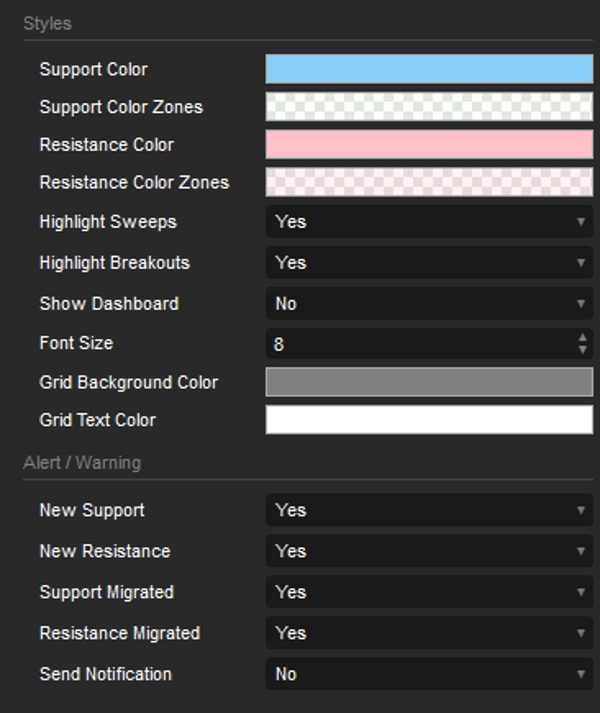
Styles et alertes
- Styles : Ajustez la configuration des couleurs des objets. Masquer/Afficher le tableau de bord.
- Alerte : Activez ou désactivez les alertes chaque fois qu'un nouveau S&R est détecté ou qu'un S&R est migré.
Résumé
Unlike traditional fixed lines, this tool defines support and resistance as dynamic price zones, with thickness and breakout buffers scaled by Average True Range (ATR) to adapt to market volatility. It features zone merging and selective visibility options to manage overlapping zones, prioritizing recent or historical structures as needed.
The indicator applies multiple filters based on price re-tests, liquidity sweeps, traded volume, and zone duration to validate structural levels. Visual signals include arrows marking swing points, dots highlighting liquidity sweeps, crosses for migrated swings, and summary labels displaying entries, strength, sweeps, volume, and duration metrics.
A dashboard provides real-time statistics on active versus total structures, mitigation percentages, average zone duration, volume, and liquidity sweep counts. Users can customize detection methods, sensitivity, zone display styles, ATR parameters, overlap handling, and structural requirements. Alerts can be enabled for new or migrated support and resistance levels.
This toolkit supports detailed market structure analysis with data-driven, volatility-adjusted zones to assist traders in identifying key price areas.


