
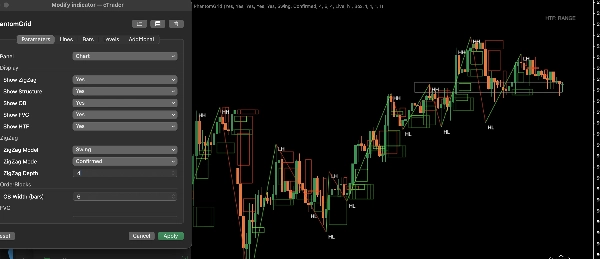
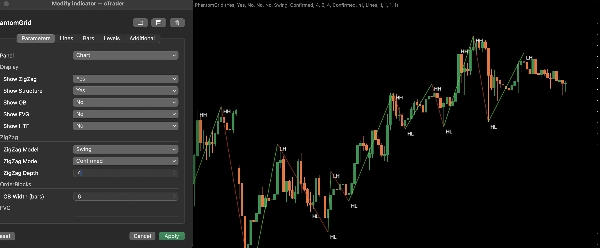
PhantomGrid est un indicateur de visualisation de grille de qualité professionnelle conçu pour apporter clarté, structure et précision à l'analyse de l'action des prix.
Il trace automatiquement des niveaux de grille dynamiques sur n'importe quel symbole et intervalle de temps, aidant les traders à identifier les zones de réaction, affiner les entrées et sorties, et planifier les trades avec une plus grande cohérence.
PhantomGrid est conçu pour les traders discrétionnaires et systématiques qui souhaitent un cadre propre et structuré sans encombrement inutile du graphique. L'indicateur s'adapte en douceur aux conditions changeantes du marché tout en maintenant une clarté visuelle et une précision à travers différents environnements.
Fonctionnalités clés
• Tracé automatique de grilles dynamiques sur tous les symboles et intervalles de temps
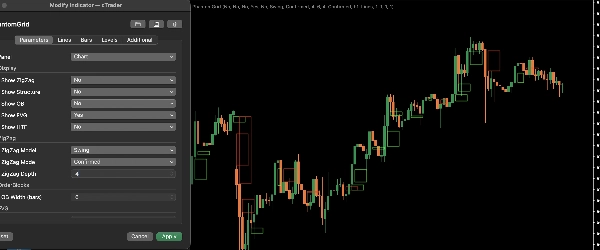
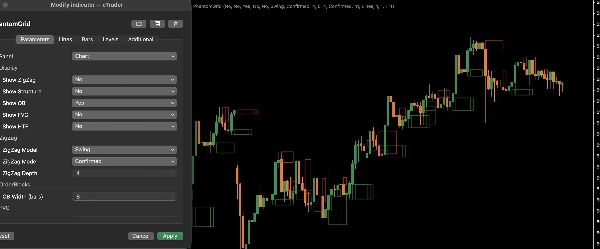
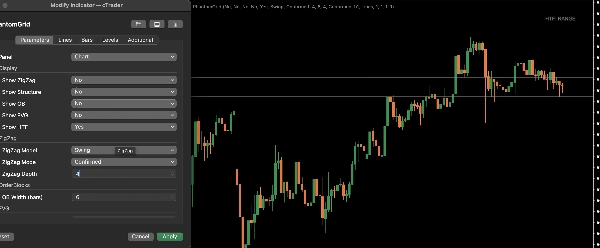
• Aide à identifier les zones de réaction, les zones de liquidité et les configurations structurées
• Design visuel propre et minimaliste pour une analyse sans distraction
• Espacement, style et comportement de la grille entièrement personnalisables
• Léger et optimisé pour une performance fluide
• Adapté aux workflows de scalping, trading intrajournalier et swing trading
Comment les traders utilisent PhantomGrid
PhantomGrid aide les traders à :
• structurer plus clairement le mouvement du marché
• identifier les zones de réaction à haute probabilité
• améliorer le timing des entrées et sorties
• gérer les trades de manière plus systématique
• maintenir la cohérence entre les instruments
Il fonctionne efficacement comme un outil autonome ou en complément des stratégies et workflows existants.
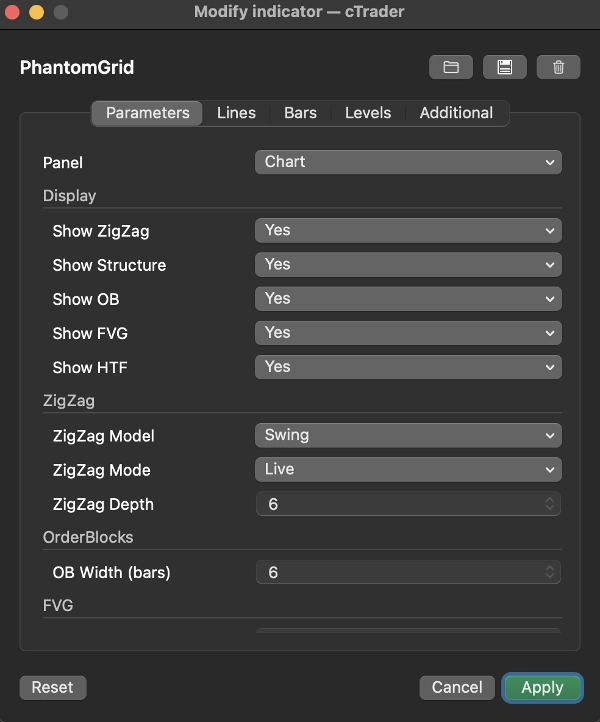
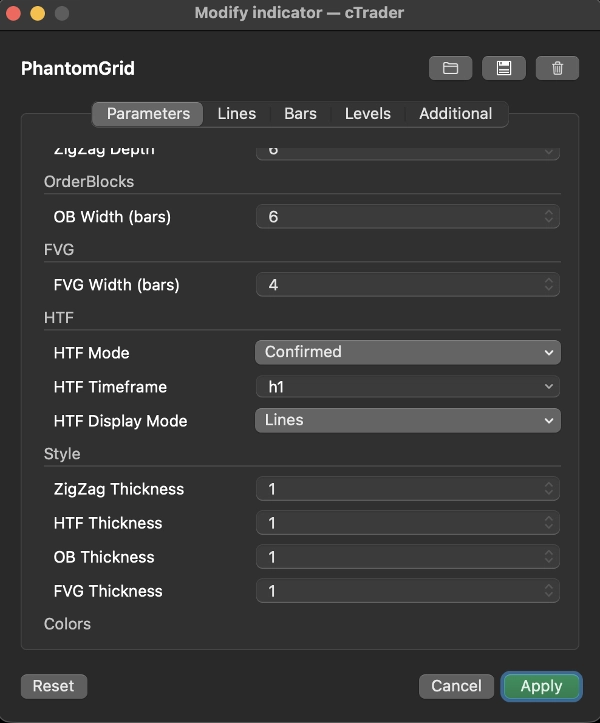
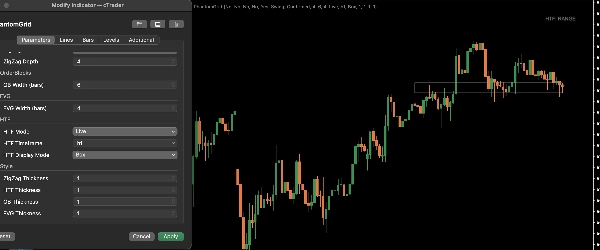
Options de personnalisation
PhantomGrid inclut des réglages flexibles pour correspondre à différents styles de trading :
• contrôles de l'espacement de la grille
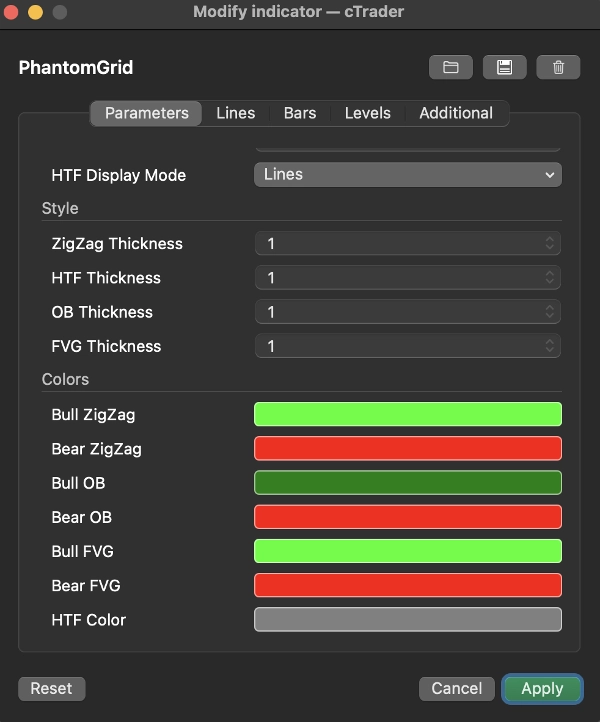
• style visuel et réglages de couleur
• ajustements de visibilité pour des mises en page plus épurées
• réglage du comportement selon les conditions de volatilité
Ces options permettent aux traders d'adapter l'indicateur à leur workflow et préférences exacts.
Performance & compatibilité
PhantomGrid est conçu pour une performance stable et efficace et fonctionne de manière fluide sur tous les symboles et intervalles de temps pris en charge dans cTrader. L'indicateur s'intègre naturellement dans les configurations de graphiques professionnelles sans ralentir la performance de la plateforme.
Comprend un essai complet de 7 jours. Aucune limitation.
Les performances passées ne garantissent pas les résultats futurs. Cet indicateur est à titre informatif uniquement et ne constitue pas un conseil financier.
5 | 100 % | |
4 | 0 % | |
3 | 0 % | |
2 | 0 % | |
1 | 0 % |


