
Description
VOLUME PROFILE FIXED RANGE — PRO
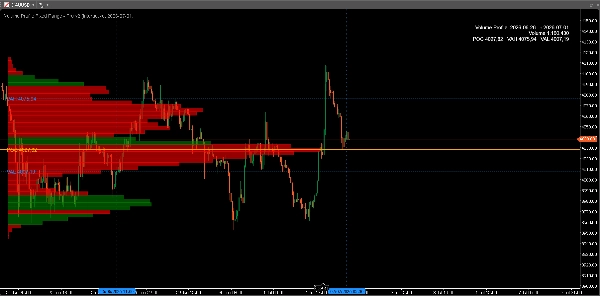
La plupart des indicateurs vous indiquent où le prix est allé. Le Volume Profile vous montre où le marché a réellement échangé — les niveaux où les acheteurs et les vendeurs ont engagé un volume réel. Ce sont ces niveaux qui continuent d'agir comme support, résistance et aimants de prix bien après la fin du mouvement.
Cet indicateur apporte un Volume Profile Fixed Range complet et professionnel à cTrader : sélectionnez n'importe quelle plage sur votre graphique et voyez instantanément sa structure de volume, le Point de Contrôle et la Zone de Valeur.
🆕 NOUVEAUTÉS DE LA VERSION 2
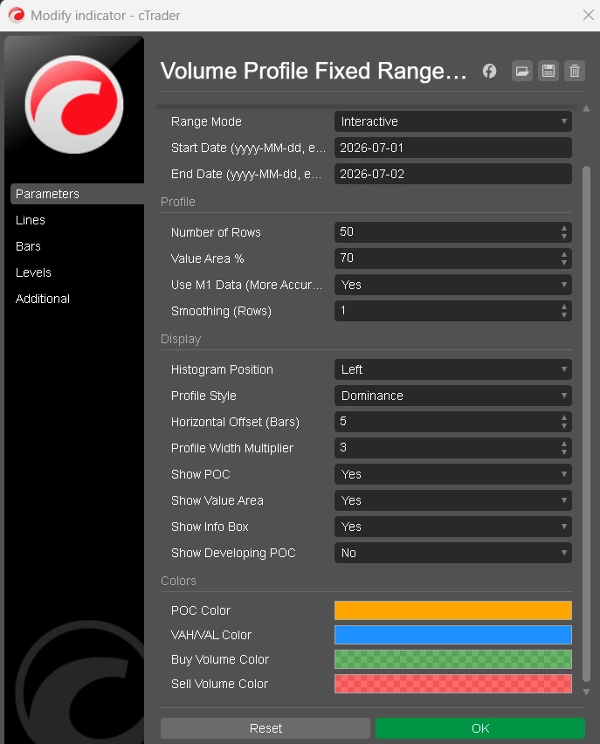
• Sélection de plage interactive — déposez l'indicateur sur le graphique et faites simplement glisser deux lignes pour définir votre plage. Pas de saisie, pas de dates, pas de configuration.
• Précision des données à la minute — le profil est construit à partir des barres M1 même sur des graphiques H1 ou journaliers, offrant une distribution de volume bien plus précise que les approximations basées sur les barres.
• Zone de Valeur standard de l'industrie — VAH et VAL sont désormais calculés avec la méthode classique d'expansion du Market Profile, de sorte que vos niveaux correspondent à ce que les professionnels voient sur d'autres plateformes.
• Histogramme de répartition achat/vente — chaque ligne montre la proportion de volume d'achat par rapport à la vente, vous permettant de repérer l'absorption et le déséquilibre en un coup d'œil.
• Rendu fluide et instantané — le profil suit votre défilement et votre zoom en temps réel, sans scintillement ni attente du tick suivant.
• Lissage ajustable — affinez la forme du profil sans déformer les niveaux clés.
• POC en développement — ligne optionnelle montrant comment le Point de Contrôle a migré à travers la plage.
• Gestion des données plus intelligente — charge automatiquement l'historique plus ancien lorsque votre plage l'exige, et vous avertit si les données disponibles sont incomplètes.
• Design adapté au thème — couleurs choisies pour rester lisibles sur les graphiques sombres et clairs, plus un panneau d'information clair avec plage, volume total, POC, VAH et VAL.
📊 CE QUE ÇA MONTRE
• POC (Point de Contrôle) — le niveau de prix avec le volume échangé le plus élevé dans la plage.
• Zone de Valeur (VAH / VAL) — la zone contenant 70 % de tout le volume (ajustable de 50 % à 95 %).
• Histogramme de volume — de 10 à 400 lignes de prix, colorées selon la dominance achat/vente ou réparties par ligne.
• POC en développement — comment le prix le plus équitable a évolué à travers la plage (optionnel).
🎯 COMMENT LES TRADERS L'UTILISENT
• Réactions de trading au POC — il se comporte souvent comme un support/résistance fort et un aimant de réversion vers la moyenne.
• Utilisez les bords de la Zone de Valeur pour définir les limites de la plage et repérer les cassures authentiques.
• Identifiez les zones de faible volume où le prix a tendance à bouger rapidement — cibles naturelles et zones de stop.
• Confirmez vos niveaux clés avec la participation réelle du marché plutôt qu'avec l'action des prix seule.
⚙️ ENTIÈREMENT AJUSTABLE
• Deux modes de plage : lignes de glissement interactives ou dates de début/fin fixes.
• Lignes, pourcentage de la Zone de Valeur, lissage, côté de l'histogramme, largeur et décalage.
• Deux styles d'histogramme : répartition achat/vente ou couleur de dominance unique.
• Chaque couleur personnalisable ; POC, Zone de Valeur, panneau d'information et POC en développement peuvent chacun être activés ou désactivés.
🔧 CONÇU POUR UNE UTILISATION QUOTIDIENNE
• Fonctionne sur n'importe quel symbole et n'importe quelle période.
• Paramètres par défaut judicieux — affichant un profil utilisable quelques secondes après son attachement.
• Léger et efficace : recalcul uniquement lorsque la plage change, pas à chaque tick.
• Achat unique. Pas d'abonnement. Mises à jour gratuites.
Si l'analyse du volume fait partie de votre processus — ou si vous souhaitez qu'elle en fasse partie — cet outil vous offre l'ensemble complet Fixed Range, conçu nativement pour cTrader.
Résumé
Users can interactively select the range by dragging lines on the chart or specify fixed start and end dates. The volume histogram displays buy and sell volume splits per price level, enabling identification of buying/selling pressure and volume imbalances. Additional features include a developing POC line showing how the fair price evolved within the range, adjustable smoothing for profile shape refinement, and a theme-aware design for readability on different chart backgrounds.
The indicator supports full customization of rows, histogram style, colors, and display elements. It automatically loads historical data as needed and recalculates only when the selected range changes, optimizing performance. It is suitable for any symbol and timeframe, providing traders with volume-based support and resistance levels, breakout zones, and areas of low volume that may indicate rapid price movement.
Avis clients
5 | 67 % | |
4 | 0 % | |
3 | 33 % | |
2 | 0 % | |
1 | 0 % |


