

Описание
FOOTPRINT PRO — ГРАФИК КЛАСТЕРОВ BID x ASK
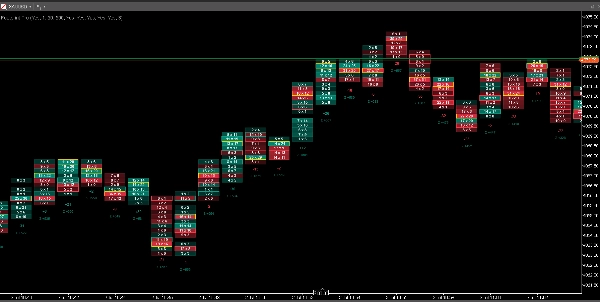
Свечи показывают, куда двигалась цена. Footprint показывает, кто её двигал. Footprint Pro разбивает каждую свечу на ценовые кластеры, построенные на основе реальных тиковых данных, показывая точно, где покупатели и продавцы сражались — и кто победил.
Это тот тип анализа потока ордеров, который обычно требует специализированной платформы и ежемесячной подписки. Footprint Pro интегрирован непосредственно в cTrader и доступен за единовременную покупку.
🆕 НОВИНКИ В ВЕРСИИ 2
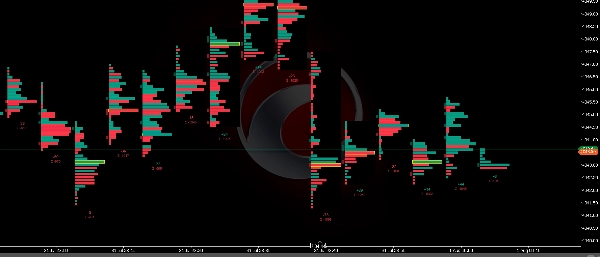
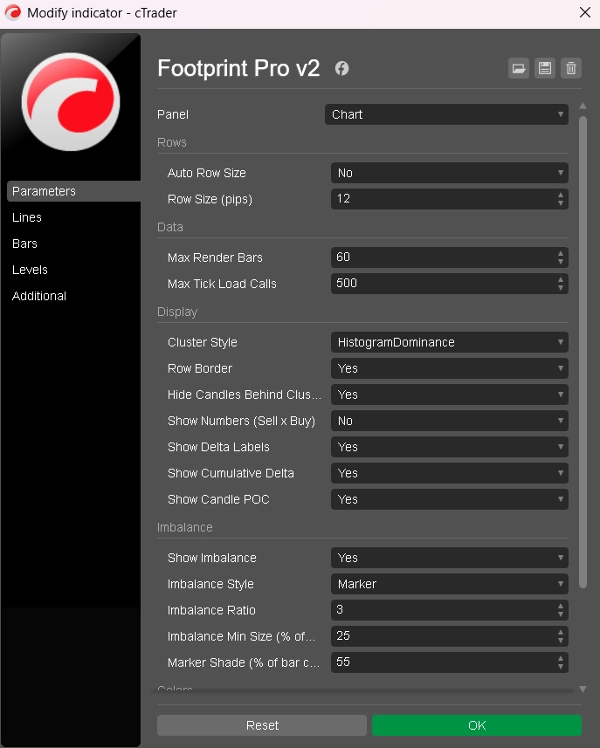
• Гистограммные кластеры — каждая строка теперь отображается в виде полосы, длина которой соответствует объему, поэтому самые активные строки выделяются без необходимости расшифровывать оттенки цвета. Выбирайте один цвет доминирования, разделение на покупку/продажу или сохраняйте оригинальную тепловую карту.
• Границы строк в цвете по вашему выбору. Установите их в цвет фона графика, и строки разделятся на четкие, равномерно расположенные полосы.
• Более чистый дисбаланс — маркеры теперь располагаются в отступе рядом со строкой, а не обрамляют её, с возможностью включения/выключения, фильтром минимального размера, чтобы отмечались только значимые строки, и оттенком, который никогда не сливается с соседней полосой.
• Единая ширина кластера — ранее разрыв сессии мог растягивать один кластер настолько, что он перекрывал соседние. Теперь каждая свеча имеет одинаковую ширину.
• Новые настройки по умолчанию для более чистого первого взгляда: фиксированные строки по 10 пунктов, стиль доминирования, числа выключены. Ваши текущие настройки не изменены.
🔍 ЧТО ВЫ ВИДИТЕ НА КАЖДОЙ СВЕЧЕ
• Кластеры объема — каждая свеча разбита на ценовые строки, и каждая строка отображается в виде полосы, длина которой соответствует объему торгов. Самая активная строка очевидна с первого взгляда, без необходимости расшифровывать цвета.
• Три стиля кластеров — доминирование (один цвет на строку, самый чистый вид), разделение покупка/продажа (каждая полоса разделена на объем продаж и покупок) или тепловая карта (полная ширина, интенсивность по активности).
• Числа Продажа x Покупка — при увеличении масштаба каждая строка может отображать точное количество тиков продажи и покупки, классифицированных по реальному движению вверх/вниз.
• POC свечи — самая активная ценовая строка каждой свечи, выделенная золотой рамкой.
• Дельта — чистая покупка против продажи за свечу, отображается под каждой полосой.
• Кумулятивная дельта — накопленная дельта сессии (Σ) под каждой свечой, сбрасывается ежедневно. Обнаруживайте дивергенции: когда цена достигает максимумов, а Σ падает — это предупреждение, которое не даст ни один график свечей.
• Маркеры дисбаланса — когда агрессия резко превосходит противоположную сторону по диагонали, в отступе рядом со строкой появляется маркер. Маркеры располагаются вне полос в отдельном столбце, чтобы кластер оставался чистым, а наложенные маркеры легко заметить — они часто указывают на институциональную активность.
⚡ СОЗДАНО НА ОСНОВЕ РЕАЛЬНЫХ ТИКОВЫХ ДАННЫХ
• Каждый кластер построен на основе фактической истории тиков вашего брокера — без приближений по барам.
• Умная ленивная загрузка: обрабатываются только видимые свечи, в фоновом режиме, чтобы ваш график никогда не зависал.
• Обновления в реальном времени: кластеры, дельта и Σ текущей свечи обновляются тик за тиком по мере торговли.
• Глубокая история: при прокрутке за пределы тиковых данных брокера Footprint Pro автоматически переключается на приближение на основе M1 и отмечает такие бары символом ≈ — никаких пустых графиков и сюрпризов.
🎯 КАК ЭТИМ ПОЛЬЗУЮТСЯ ТРЕЙДЕРЫ
• Подтверждение пробоев: сильная дельта и наложенные дисбалансы в свече пробоя отделяют реальные движения от ловушек.
• Сглаживание истощения: высокий объем с уменьшающейся дельтой на максимуме/минимуме колебания сигнализирует об абсорбции.
• Чтение дивергенций: рост цены + падение кумулятивной дельты = ралли без реальных покупок.
• Уточнение входов: входите на уровне POC свечи или уровнях дисбаланса вместо произвольных цен.
⚙️ ПОЛНОСТЬЮ НАСТРАИВАЕМЫЙ
• Фиксированный размер строки в пунктах или автоматическое масштабирование, адаптирующееся к диапазону символа.
• Границы строк с вашим цветом — установите их в цвет фона графика, и строки разделятся на четкие, равномерно расположенные полосы.
• Управление дисбалансом: включение/выключение, маркер или контур, соотношение и фильтр минимального размера, чтобы отмечались только действительно значимые строки.
• Переключение чисел, меток дельты, кумулятивной дельты и POC свечи независимо друг от друга.
• Каждый цвет настраивается, плюс лимит рендеринга и размер шрифта.
• Свечи автоматически скрываются за кластерами для чистого, профессионального вида footprint.
🧪 ПОПРОБУЙТЕ ПЕРЕД ПОКУПКОЙ
Доступна бесплатная пробная версия — тот же движок, отображающий последние 15 свечей. Сначала протестируйте на данных вашего брокера, затем обновитесь до полной версии.
Работает с любым символом. Лучше всего использовать на графиках M1–M15. Единовременная покупка, без подписки, бесплатные обновления.
Сводка
The indicator updates live with tick-by-tick data and uses smart lazy loading to maintain chart performance. When tick data is unavailable, it switches to an approximate mode based on 1-minute bars, clearly marking these bars. Footprint Pro supports full customization of row sizing, display options (numbers, delta labels, POC, imbalances), color schemes, and imbalance sensitivity.
Traders use Footprint Pro to confirm breakouts, detect exhaustion and absorption, identify divergences between price and volume, and refine entry points based on volume clusters rather than arbitrary prices. It works on any symbol, is optimized for 1- to 15-minute charts, and is available as a one-time purchase with free updates. A free trial version displays the most recent 15 candles for evaluation.


















![Логотип продукта "Wyckoff Toolkit [Iridio Capital]"](https://cdn.ctrader.com/image/webp/5318c788-91ef-4297-bca6-4ce73b1516a8_61556)