present
Sign up and get $50 off your first purchase
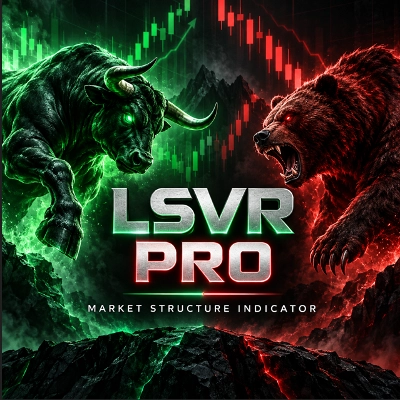
Trading product for LSVR Pro Indicator Fibonacci Key Levels, image 2
Trading product for LSVR Pro Indicator Fibonacci Key Levels, image 3
Trading product for LSVR Pro Indicator Fibonacci Key Levels, image 4
Trading product for LSVR Pro Indicator Fibonacci Key Levels, image 5
Since 04/09/2026
1
Sales

Description

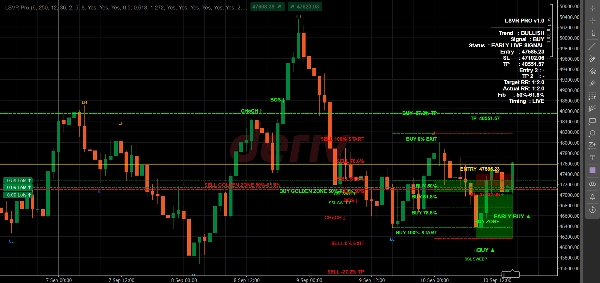
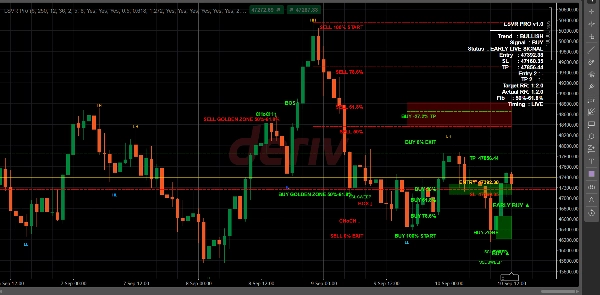
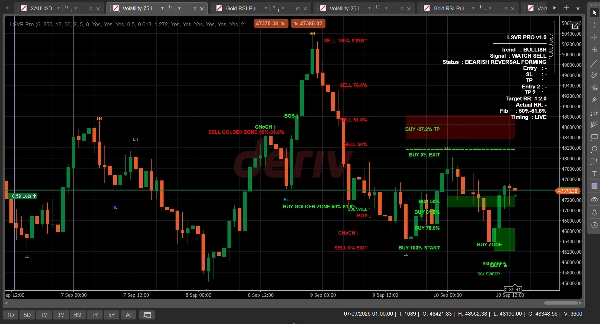
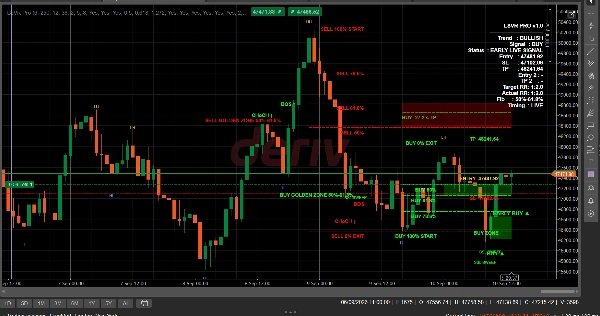
LSVR Pro is a chart-based market-structure indicator designed to help traders identify potential trend direction, key price zones and confirmed trade setups.

It provides a clear visual framework for analysing price action without placing trades automatically. The indicator is intended to support disciplined decision-making, not replace risk management or independent analysis.

Key features:

• Market-structure guidance, including Break of Structure (BOS) visual cues
• Buy and sell zone identification to highlight potential reaction areas
• Fibonacci-based reference levels, including 100% and 78.6% levels
• Confirmed-candle signal logic to reduce intrabar signal changes
• Clear on-chart visuals designed for fast analysis
• Suitable for reviewing setups across different instruments and timeframes
• Manual-trading focused, no automatic orders are placed

LSVR Pro is designed for traders who want a structured way to review price action, assess potential entries and manage trade ideas with greater consistency.

How to use:

  1. Apply LSVR Pro to your preferred chart.
  2. Select your preferred timeframe.
  3. Review the market-structure direction and highlighted zones.
  4. Wait for candle confirmation before making a trading decision.
  5. Always define your own stop loss, take profit and position size.

Important: LSVR Pro is an analytical tool only. Trading involves risk, and past performance or signals do not guarantee future results. Users should test the indicator on a demo account and apply appropriate risk management before trading live.

Summary

AI summary
LSVR Pro is a chart-based market structure indicator designed to assist traders in analyzing price action and identifying potential trend directions, key price zones, and confirmed trade setups. It provides visual cues for Break of Structure (BOS), liquidity sweeps, and smart buy/sell zones with suggested entry, stop loss (SL), and take profit (TP) levels. The indicator incorporates Fibonacci-based reference levels, including 100% and 78.6% retracements, to highlight important price areas.

LSVR Pro uses confirmed-candle signal logic to minimize intrabar signal fluctuations, offering clear on-chart visuals for fast and structured analysis. It supports multiple instruments and timeframes, focusing on manual trading without placing automatic orders. Traders apply the indicator to their preferred charts and timeframes, review market structure and highlighted zones, and wait for candle confirmation before making trading decisions. Users are responsible for defining their own risk management parameters such as stop loss, take profit, and position sizing.

This tool is intended to support disciplined decision-making by providing a structured framework for reviewing price action, assessing potential entries, and managing trade ideas consistently. It is an analytical tool only and does not guarantee trading outcomes.
Indicator profile
Indicator category
Market structure (SMC)
Output type
Visualisation
Signals
Data requirements
Bars only
Supported signals
Breakout
Reversal
Level touch

Discussion

Customer reviews

4.5
Reviews: 4
5
50 %
4
50 %
3
0 %
2
0 %
1
0 %
Customer reviews
October 30, 2026
The Fibonacci levels are more informative when read alongside the structure markings. Confirmed candle signals set a clear pace for the overlay rather than responding to every intrabar movement. A useful visual framework for manual analysis.
October 17, 2026
Confirmed candle signals, BOS context and highlighted zones give the 78.6% and 100% Fibonacci references a coherent manual analysis framework rather than leaving the levels floating on their own.
October 13, 2026
BOS and highlighted zones give the 78.6% and 100% references useful context. Waiting for a confirmed candle keeps the signal tied to a completed setup. It remains a manual overlay, with position sizing and exits decided separately.
October 4, 2026
LSVR Pro displayed BOS/CHoCH structures, liquidity sweeps, Fibonacci levels, BUY/SELL zones, and a setup status panel across EURUSD H1 and XAUUSD H1/M1. The XAUUSD H1 setup showed consistent Entry, SL, TP, and a 1:2 risk/reward ratio. The indicator is informative, although overlapping labels can reduce readability on busy charts. A useful market-structure analysis tool.

FAQ

Fibonacci
Key Levels
BOS
Liquidity Sweep
Market Structure
Support & Resistance
Products available through cTrader Store, including trading bots, indicators and plugins, are provided by third-party developers and made available for informational and technical access purposes only. cTrader Store is not a broker and does not provide investment advice, personal recommendations or any guarantee of future performance.

You may also like

Indicator
AI
ATR
+26
The Triple Momentum indicator for cTrader is a versatile trend-following tool.
Indicator
RSI
MACD
+5
An advanced indicator merging Smart Money Concepts, Gann Sq9 targets, Monte Carlo analysis, and MTF trend bias.
Indicator
RSI
Forex
+7
Advanced S/R + liquidity zone detector with auto-configured trade styles. Generates filtered entry signals with TP/SL.
Indicator
Doji
Engulfing
+1
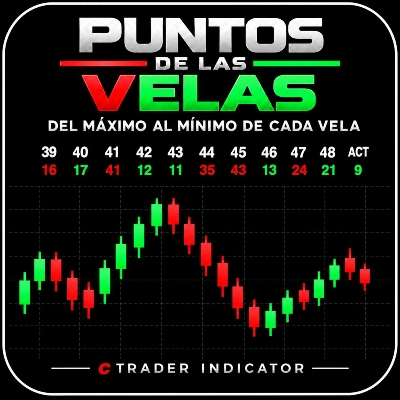
Mide en puntos la distancia entre el Máximo y el Mínimo alcanzados por cada vela, incluida la vela actual.
Indicator
ATR
RSI
+5
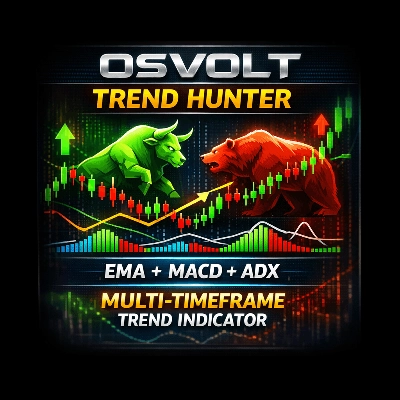
Multi-timeframe trend indicator using EMA, MACD & ADX to confirm high-probability buy and sell bias.
Indicator
Prop
Forex
+2
Vision - Advanced Session Indicator
Indicator
Key Levels
Fair Value Gap
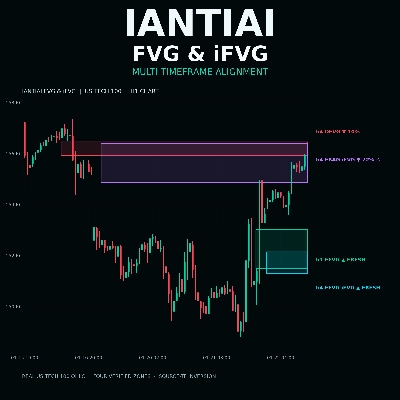
IANTIAI FVG & iFVG: Multi-timeframe zones with automatic alignment
Indicator
ATR
Prop
+5
Anchor volume profiles to pivots with POC, VAH, VAL and real-time insights for clearer trade decisions.
Indicator
RSI
Key Levels
+1
A 28-pair linear regression array and ranking ladder displaying relative currency momentum and possible reversals
Indicator
RSI
SMC
+17
Turn WaveTrend Cross into a BTC profit machine precise buy sell signals, smart momentum edge, no lag trading system
Indicator
ATR
A multi-currency indicator that tracks the relative strength of eight global currencies across every timeframe available
Indicator
AI
ATR
+18
Scalping signals with EMA/RSI/ATR logic. Visual cloud shows precise entry and exit zones. Built for M1/M5 scalpers.
Indicator
RSI
MACD
+5
LudwigICT – Digital Root & IDR (cTrader Automate)
Indicator
SMC
Grid
+19
Smart fractals + auto Fibonacci + dynamic S/R zones with HTF confluence & Bull/Bear bias panel. Institutional-grade.
Indicator
AI
ATR
+27
The Fibonacci Automated Levels Indicator is a smart trading tool that automatically detects the most recent market.
Indicator
SMC
Forex
+5
📊 Detects Fair Value Gaps with lower timeframe volume analysis & clean dashboard 🟢🔴
Indicator
Forex
Signal
Literally the best Linear Regression Indicator out there. 8 distinct mathematical models and more!
Indicator
Grid
Prop
+5
Logarithmic Framework by LudwigICT

Price

Since 04/09/2026
1
Sales