
Description
⚡ NEXT-GENERATION VERSION AVAILABLE: 🚫🚫🚫 Don't buy this indicator here!
This classic LudwigICT tool has been redesigned, restructured, and re-released under our new developer brand, PrimeQuant. The new version features a streamlined UI and updated properties for current market conditions. Get the upgraded version at a discounted price here:
👉 Logarithmic Market Map Pro
👉 Logarithmic Market Map Pro
👉 Logarithmic Market Map Pro
⚠️ We moved to 👉 PrimeQuant
(Please note: The LudwigICT listing remains active for legacy users but will no longer receive updates or active price discounts.)
🚀 Introducing the Logarithmic Framework by LudwigICT 🚀
Bring order to market chaos with a professional charting tool designed for traders who demand structure, clarity, and precision.
✨ Key Features:
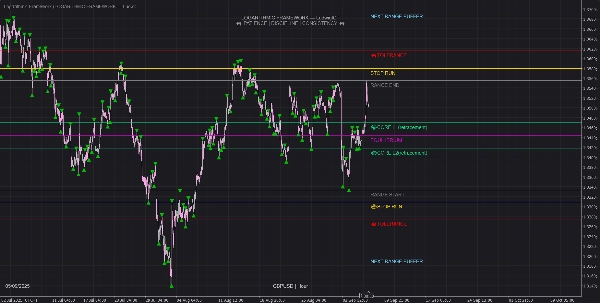
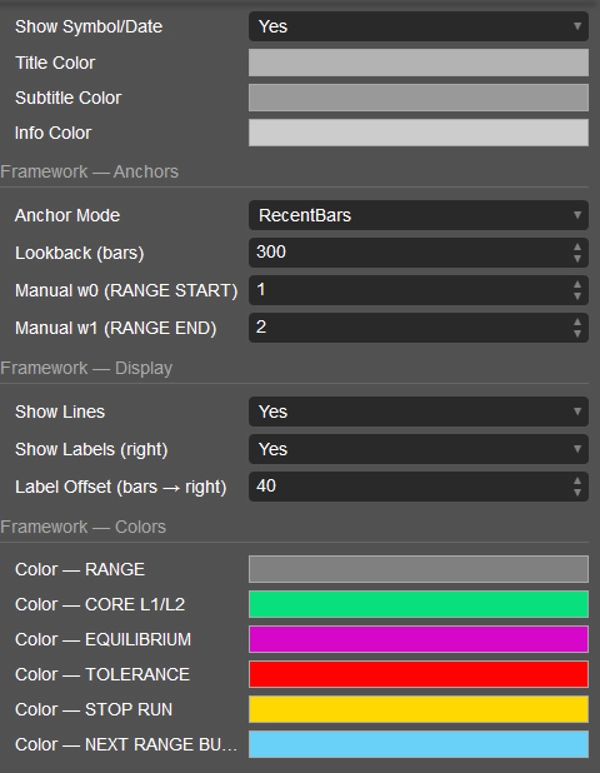
🔹 Logarithmic Framework Grid – Automatic liquidity zones, equilibrium, and stop-run levels mapped with precision.
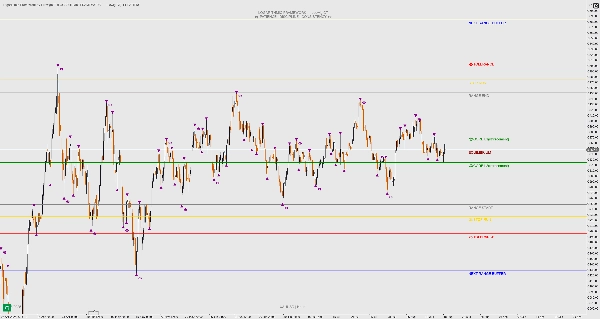
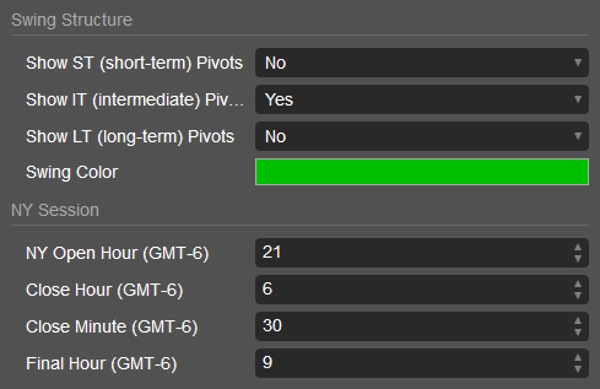
🔹 Multi-Tier Market Structure – Short-, intermediate-, and long-term swing pivots for a clean hierarchy of price action.
🔹 New York Session Mapping – True open line, daily high/low, and session timing markers for ICT-style session trading.
🔹 Visual Elegance – Watermark, dynamic labels, and a clean layout to keep your charts sharp and professional.
This isn’t just an indicator – it’s a complete market framework that helps you spot liquidity runs, track structure shifts, and trade with confidence in the most important session of the day.
📊 Designed for traders who want clarity over clutter.
This tool creates a map of price structure and liquidity zones based on a logarithmic framework. It also tracks swing market structure across different time tiers and overlays NY session dynamics. The goal is to help you visually align with higher-order price structure and liquidity levels, while keeping your chart neat and consistent.
If you have any questions or run into any issues, feel free to contact me. I'm happy to help You!
Disclaimer:
By using my algorithms, you acknowledge that trading involves inherent risks and that past performance does not guarantee future results. It is essential that you have a solid risk management strategy in place and, above all, that you remain disciplined in adhering to stop-loss levels. Failure to manage risk properly can lead to significant losses. I am not responsible for any financial outcomes resulting from the use of these algorithms. Trade responsibly and always follow proper risk management practices.
Bless up! 🙌
Summary
Customer reviews
5 | 67 % | |
4 | 33 % | |
3 | 0 % | |
2 | 0 % | |
1 | 0 % |


