
Description
🎯 INTELLIGENCE DE VOLATILITÉ MULTI-ÉCHELLES DE TEMPS
Ne ratez plus les cassures de volatilité - Voyez chaque échelle de temps simultanément
La plupart des indicateurs de volatilité ne vous montrent qu'une seule perspective. Notre Indicateur de Volatilité Mobile Multi-Échelles de Temps vous donne une vue complète sur les périodes court terme (7), moyen terme (21) et long terme (63) - avec signaux de trading intégrés qui vous indiquent exactement quand agir.
⚡ POURQUOI LA VOLATILITÉ MULTI-ÉCHELLES CHANGE TOUT
Échelle unique vs notre approche multi-échelles :
- ❌ Période unique : Vous voyez les arbres mais pas la forêt
- ✅ Trois périodes : Paysage complet de la volatilité avec contexte
Scénarios de trading réels :
- Pic à court terme alors que le long terme est calme → Bruit temporaire (ignorer)
- Toutes les échelles montent → Changement de régime réel (agir)
- Calme à court terme au milieu du chaos à long terme → Faux calme (prudence)
🎯 FONCTIONNALITÉS PROFESSIONNELLES
✨ VISIBILITÉ TRIPLE ÉCHELLE DE TEMPS
- StdDev 7 : Capturez les changements immédiats de volatilité (intraday)
- StdDev 21 : Volatilité moyen terme (swing trading)
- StdDev 63 : Contexte de volatilité long terme (position trading)
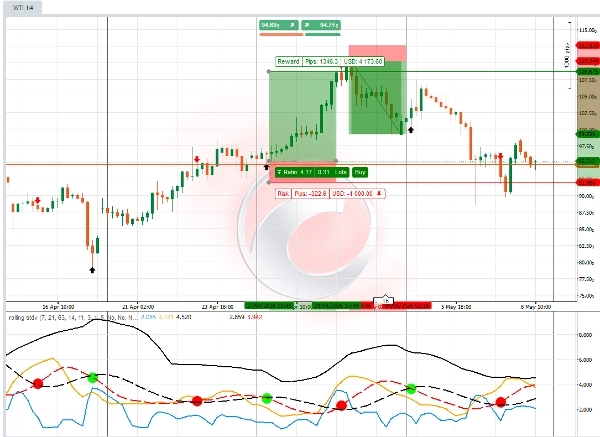
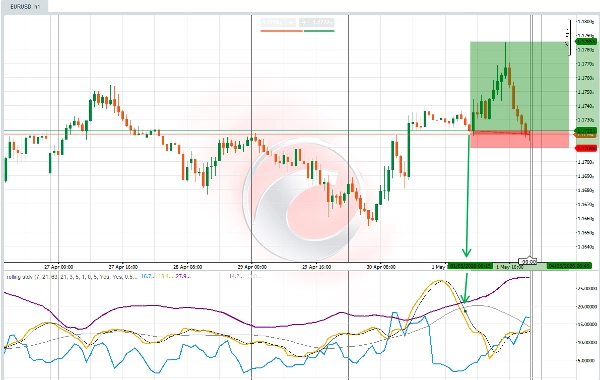
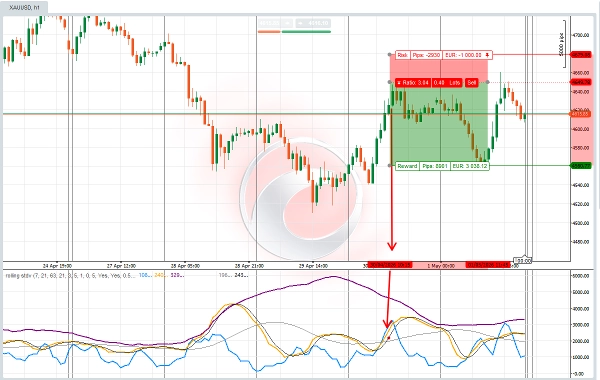
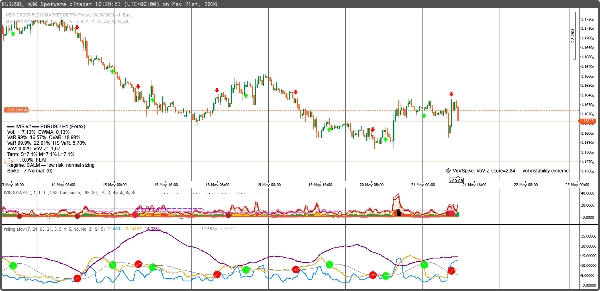
- Signal d'oscillateur : lorsque les lignes de signal de l'écart-type mobile moyen se croisent, les points colorés confirment une volatilité plus élevée ou plus faible ainsi que la direction de l'action des prix. Avec un signal de point rouge et de point vert important, le trader verra également un signal de flèche rouge et de flèche verte sur le graphique, ce qui peut aider à décider des niveaux d'entrée et de la taille de la transaction.
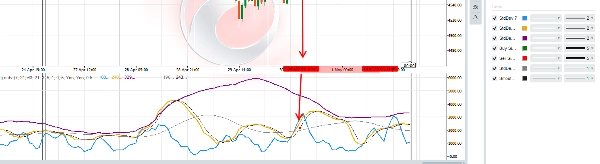
- L'écart-type mobile est un oscillateur de volatilité avec une logique de signal de marché prédictive. Les paramètres du panneau doivent être vérifiés et adaptés au type d'instrument CFD que le trader souhaite négocier. Chaque instrument CFD d'actif financier peut avoir des réglages légèrement différents sur le panneau. Les traders peuvent choisir la précision et la justesse des lectures de volatilité, en activant : pente, signal de croisement rapide/moyen, et lissage.
📊 ANALYSE AVANCÉE DE LA VOLATILITÉ
- Croisements de volatilité : lignes StdDev qui se croisent = changements de régime
- Signaux de retour à la moyenne : Volatilité revenant à la moyenne
- Détection de pics : Événements de volatilité extrême
💡 PARFAIT POUR CES STYLES DE TRADING :
🎯 Traders de cassures de volatilité
- Entrer pendant une faible volatilité avant des mouvements explosifs
- Sortir pendant une forte volatilité avant des retournements
- Synchroniser les entrées avec précision grâce à une triple confirmation
📈 Traders de retour à la moyenne
- Atténuer les extrêmes de volatilité avec confiance
- Identifier les conditions de marché surétendues
- Utiliser la volatilité comme indicateur contrarien
🛡 Traders prudents
- Éviter complètement les périodes de forte volatilité
- Trader uniquement pendant les marchés calmes et prévisibles
- Utiliser la volatilité comme guide de dimensionnement des positions
📊 Traders d'options
- Vente de prime temporelle pendant une forte volatilité
- Achat d'options pendant la compression de volatilité
- Analyse IV vs HV pour détection de sous-évaluation
Signaux intelligents intégrés :
- ✅ Acheter quand : la volatilité descend en dessous du seuil OU croise en dessous de la moyenne mobile
- ✅ Vendre quand : la volatilité monte au-dessus du seuil OU croise au-dessus de la moyenne mobile
📈 CE QUE VOUS OBTENEZ :
✅ Visibilité triple échelle de temps - Plus besoin de deviner le contexte de volatilité
✅ Signaux d'achat/vente automatisés - Flèches visuelles claires aux points optimaux
✅ Détection de régime de volatilité - Sachez quand les marchés sont calmes ou chaotiques
✅ Seuils personnalisables - Adapté à tout style de trading ou actif
✅ Codage couleur professionnel - Compréhension visuelle instantanée
💰 PRIX DE LANCEMENT SPÉCIAL : 50 $
(Prix régulier : 100 $)
Répartition de la valeur :
- Indicateur StdDev 7 : valeur de 29 $
- Indicateur StdDev 21 : valeur de 29 $
- Indicateur StdDev 63 : valeur de 29 $
- Signaux de trading : valeur de 49 $
- Valeur totale : 136 $
- Votre prix : 50 $ (Économisez 35 %)
Inclus : Indicateur complet Couleur
🎁 BONUS : Guide gratuit de synchronisation de la volatilité
L'achat inclut "Maîtrise de la volatilité multi-échelles" - une valeur de 39 $ GRATUITE.
Comprend :
- Stratégies de trading basées sur la compression de la volatilité
- Techniques de confirmation multi-échelles
- Gestion des risques pour les périodes volatiles
- Exemples de trades réels
🚀 PRÊT À MAÎTRISER LE TIMING DE LA VOLATILITÉ ?
Cliquez sur "Ajouter au panier" et transformez votre façon de voir et de trader la volatilité du marché.
"J'ai essayé tous les indicateurs de volatilité existants. Cette approche triple échelle avec signaux intégrés est ce que j'utilise quotidiennement dans mon trading en prop firm."
- Sarah Rodriguez, Trader Swing professionnel
PARFAIT POUR CES MARCHÉS :
📊 Actions & ETFs
- Synchronisation de la volatilité SPY, QQQ
- Rotation sectorielle basée sur la volatilité
- Stratégies sur la volatilité des résultats
💹 Paires Forex
- Analyse de la volatilité des principales paires
- Évaluation du risque du carry trade
- Confirmation de cassure
📈 Matières premières
- Cycles de volatilité de l'or
- Pics de volatilité du pétrole
- Volatilité saisonnière agricole
🔄 Cryptomonnaies
- Régimes de volatilité BTC/ETH
- Opportunités de volatilité Altcoin
- Gestion des risques en crypto
En résumé : Ce n'est pas simplement un autre indicateur d'écart-type. C'est un système complet de timing de la volatilité qui vous montre exactement quand les marchés sont sur le point de bouger.
Offre de lancement limitée : 150 premières copies à 89 $ (économisez 30 $)
"La différence entre le trading amateur et professionnel se résume souvent au timing de la volatilité. Cet indicateur comble cet écart."
Ajoutez au panier maintenant → Commencez à trader la volatilité comme un pro.
Résumé
Key features include:
- Triple timeframe visibility for immediate, swing, and position trading contexts.
- Volatility crossovers signaling regime shifts.
- Mean reversion and spike detection for volatility extremes.
- Customizable parameters to adapt to different CFD instruments and trading styles.
- Professional color-coded signals for quick interpretation.
This indicator suits various trading styles, including volatility breakout, mean reversion, risk-averse, and options trading. It supports multiple markets such as stocks, ETFs, forex pairs, commodities, and cryptocurrencies, providing volatility timing insights for assets like SPY, QQQ, gold, oil, BTC, and ETH.
Included with the indicator is a volatility timing guide covering compression strategies, multi-timeframe confirmation, risk management, and real trade examples. The tool requires tick data and outputs actionable signals to enhance volatility-based trading decisions.
Avis clients
5 | 50 % | |
4 | 50 % | |
3 | 0 % | |
2 | 0 % | |
1 | 0 % |


![Logo de "Smart Money Concepts (SMC) [Iridio Capital]"](https://cdn.ctrader.com/image/webp/28b69fd1-ef54-4bed-9487-07e78e883be4_40934)


