
Description
TheVibe NASDAQ Liquidity Cycles est un surligneur de session de qualité professionnelle conçu spécifiquement pour le NASDAQ 100. Il élimine le besoin de suivre manuellement les différences de fuseau horaire ou de deviner quand le volume va augmenter en affichant visuellement les heures exactes du marché de New York juste devant vous.
Parce que la logique est basée sur le temps absolu plutôt que sur le nombre de barres, cet indicateur est complètement indépendant de l’échelle de temps — fonctionnant parfaitement que vous scalpez sur un graphique d’une minute ou que vous fassiez du swing trading sur un graphique d’une heure.
À qui s’adresse cet outil & comment l’utiliser : Cet indicateur est spécialement conçu pour les day traders et les traders de momentum qui comptent sur un timing précis et une volatilité purement basée sur le volume pour leurs configurations.
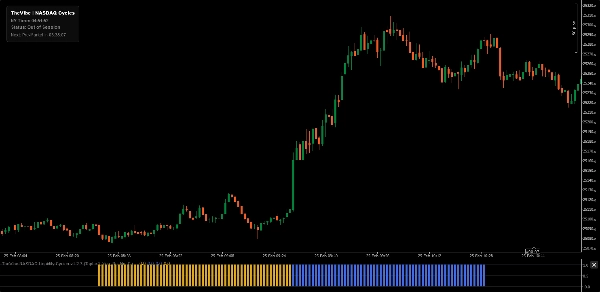
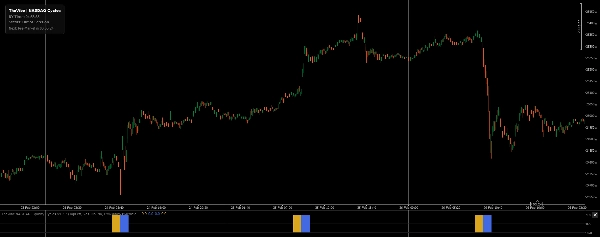
- Interprétation : L’indicateur trace des blocs d’histogramme solides et codés par couleur dans la sous-fenêtre chaque fois qu’une session clé de liquidité est active. En ayant ces données de timing visuellement cartographiées sur votre écran, vous pouvez aligner facilement votre trading avec des fenêtres à haute probabilité et éviter les périodes agitées à faible liquidité sans jamais avoir besoin de vérifier une horloge externe.
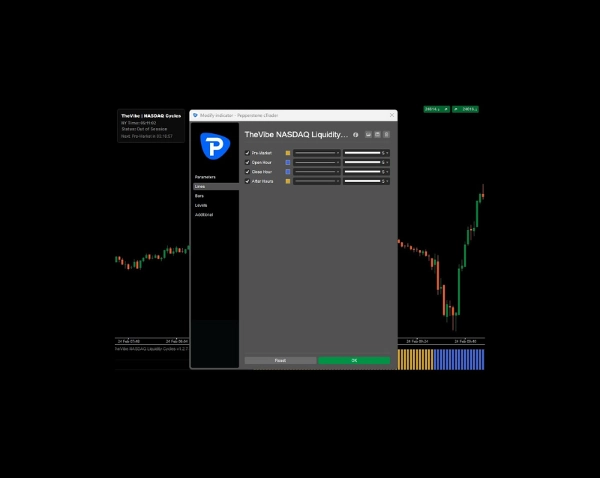
Phases clés de liquidité suivies :
- Pré-marché (8h30 - 9h30 NY) : L’heure institutionnelle du pré-marché, axée sur les nouvelles à fort impact et le positionnement précoce.
- Heure d’ouverture (9h30 - 10h30 NY) : La fenêtre de volatilité à l’ouverture, essentielle pour la découverte initiale des prix et l’afflux de volume.
- Heure de clôture (15h00 - 16h00 NY) : L’« heure de puissance » et la clôture croisée, mettant en lumière le momentum institutionnel de fin de journée et le réglage des positions.
- Après-marché (16h00 - 17h00 NY) : L’heure de règlement post-marché, capturant la phase finale de liquidité à la fin des échanges standards.
Caractéristiques principales :
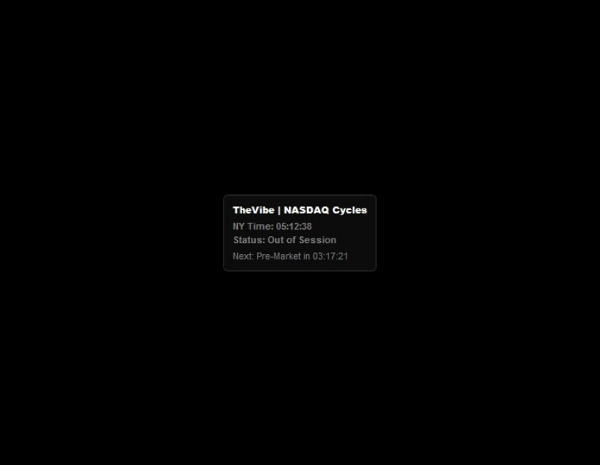
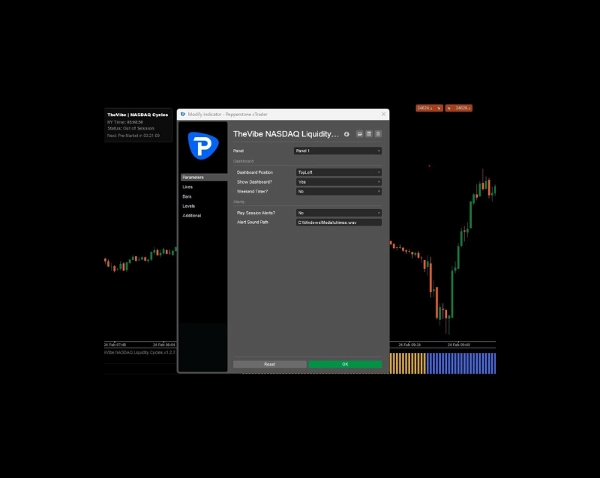
- Tableau de bord interactif avec compte à rebours : Un HUD dynamique sur le graphique qui affiche l’heure exacte de New York, votre session active actuelle, et un compte à rebours en direct jusqu’à la prochaine fenêtre de liquidité.
- Positionnement dynamique : Fixez le tableau de bord à n’importe quel des quatre coins de votre graphique (par défaut en bas à gauche) pour garder votre action de prix complètement dégagée.
- Moteur avancé de fuseau horaire : Synchronise automatiquement votre heure locale ou celle du serveur du courtier avec l’heure exacte de New York (gère automatiquement EST/EDT).
- Logique intelligente pour le week-end : Choisissez de masquer le compte à rebours pendant le week-end ou d’afficher les jours et heures exacts restants jusqu’à l’ouverture du pré-marché du lundi.
- Alertes sonores : Sons de notification optionnels qui se déclenchent au moment exact où une fenêtre de liquidité ciblée s’ouvre ou se ferme.
Recommandation d’affichage : Pour une gestion optimale de l’espace de travail, ajustez la hauteur de la sous-fenêtre de l’indicateur à une taille compacte. Cela vous donne une « barre de rythme » claire et discrète de la liquidité du jour tout en préservant un maximum d’espace d’écran pour votre graphique principal des prix.
Note : Le minuteur automatique suppose des heures de trading standard du lundi au vendredi et ne prend pas automatiquement en compte les jours fériés américains ou les fermetures anticipées du marché.
Résumé
Avis clients
5 | 0 % | |
4 | 100 % | |
3 | 0 % | |
2 | 0 % | |
1 | 0 % |


