
Sero
Indicateur
105 téléchargements
Version 1.0, Mar 2026
Windows, Mac
Description
Sero — Oscillateur de Momentum
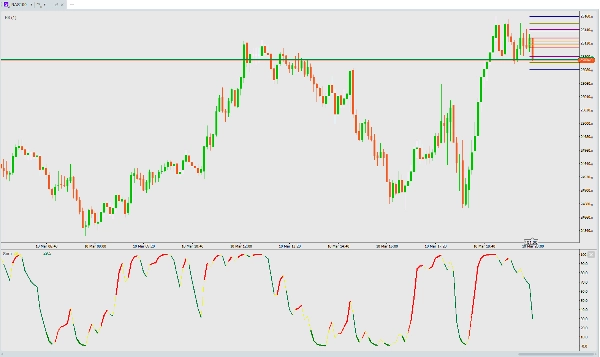
Sero est un oscillateur de momentum basé sur le stochastique qui fournit des signaux visuels clairs et codés par couleur pour les changements de momentum du marché.
Comment ça fonctionne
Sero calcule une valeur stochastique lissée à partir du Prix Typique (Haut+Bas+Clôture)/3 sur une plage de 15 barres, puis applique une EMA rapide de 2 périodes pour produire un oscillateur réactif de 0 à 100.
À quoi faire attention
Les couleurs racontent l'histoire :
- Ligne jaune — la valeur de base de Sero (toujours visible)
- Ligne rouge — momentum haussier (Sero est en hausse)
- Ligne rouge épaisse — fort momentum haussier (en hausse + au-dessus de 20 — confirmant la cassure depuis la zone survendue)
- Ligne verte — momentum baissier (Sero est en baisse)
- Ligne verte épaisse — forte chute baissière (en baisse + en dessous de 20 — profondément en zone survendue)
Signaux clés :
- Signal d'achat — la couleur passe du vert au rouge, surtout depuis en dessous de 20 (renversement en zone survendue)
- Signal de vente — la couleur passe du rouge au vert, surtout depuis au-dessus de 80 (renversement en zone surachetée)
- Tendance forte — les lignes épaisses confirment la conviction du momentum
- Épuisement — ligne verte épaisse en dessous de 20 = les vendeurs pourraient manquer de force, surveillez un renversement
Bonnes pratiques
- Fonctionne sur toutes les périodes et tous les instruments
- À combiner avec l'action des prix ou les niveaux de support/résistance pour confirmation
- Les transitions de couleur près des extrêmes (0 ou 100) sont les signaux les plus probables
- Aucun réglage nécessaire — optimisé et prêt à l'emploi
Résumé
Résumé IA
Sero is a stochastic-based momentum oscillator designed to identify market momentum shifts through clear, color-coded visual signals. It calculates a smoothed stochastic value from the Typical Price [(High + Low + Close) / 3] over a 15-bar range, then applies a fast 2-period exponential moving average (EMA) to generate a responsive oscillator ranging from 0 to 100.
The indicator displays multiple colored lines to represent momentum states:
- Yellow line: base Sero value (always visible)
- Red line: bullish momentum (rising oscillator)
- Thick red line: strong bullish momentum (rising and above 20, indicating breakout from oversold)
- Green line: bearish momentum (falling oscillator)
- Thick green line: strong bearish momentum (falling and below 20, indicating deep oversold conditions)
Key signals include buy signals when the color flips from green to red, especially below 20 (oversold reversal), and sell signals when it flips from red to green, especially above 80 (overbought reversal). Thick lines confirm strong momentum trends, while thick green lines below 20 may indicate exhaustion of selling pressure and potential reversal.
Sero works on any timeframe and instrument without requiring user settings, and it is recommended to combine it with price action or support/resistance levels for confirmation. Color transitions near extremes (0 or 100) provide the highest-probability signals.
Profil de l'indicateur
Avis clients
0.0
Avis : 0
Avis clients
Il n'y a pas encore d'avis sur ce produit. Vous l'avez déjà essayé ? Soyez le premier à en parler aux autres !
Discussion
Questions fréquentes
BTCUSD
Forex
Signal
Indices
EURUSD
Commodities
GBPUSD
NZDUSD
Crypto
Stocks
XAUUSD
NAS100
USDJPY
Les produits disponibles sur cTrader Store, notamment les bots de trading, les indicateurs et les plug-ins, sont fournis par des développeurs tiers et mis à disposition à titre informatif et à des fins d'accès technique uniquement. cTrader Store n'est pas un courtier et ne fournit aucun conseil en investissement, aucune recommandation personnelle ni aucune garantie quant aux performances futures.
Plus de cet auteur


Prix
Depuis le 10/03/2026
105
Installations gratuites