
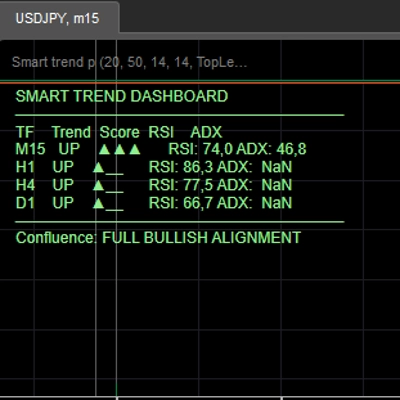
Smart trend dashboard
Indicateur
Version 1.0, Jul 2026
Windows, Mac
Depuis le 30/05/2026
1
Ventes
Description
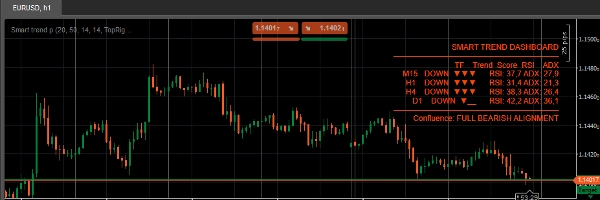
Arrêtez de passer d'un intervalle de temps à un autre pour vérifier si votre tendance tient réellement. Smart Trend Dashboard analyse simultanément M15, H1, H4 et D1 et vous donne un score composite unique par intervalle (-3 à +3) qui combine la direction de l'EMA, la confirmation DI+/DI- et le momentum RSI — avec l'ADX filtrant les tendances faibles et instables pour que vous ne soyez pas trompé par le bruit.
Caractéristiques principales :
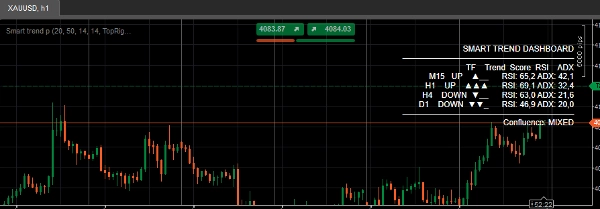
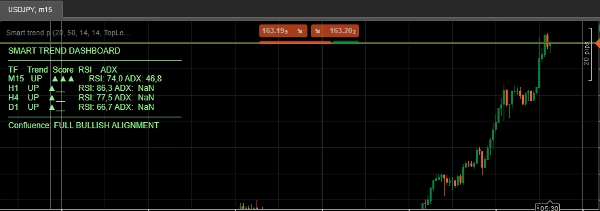
- Panneau multi-intervalle en direct (M15 / H1 / H4 / D1) directement sur votre graphique
- Score composite de tendance par intervalle — un seul chiffre, pas quatre indicateurs à interpréter
- Barres de force visuelles (▲▲▲ / ▼▼_) pour une lecture instantanée d'un coup d'œil
- Notation filtrée par l'ADX — les tendances faibles/instables sont automatiquement atténuées
- Détection complète de confluence — signale lorsque tous les intervalles sont d'accord
- Alerte sonore lors d'un alignement haussier/baissier complet
- Panneau codé par couleur (vert = alignement haussier, rouge = baissier, blanc = mixte)
- Léger — pas de repaint, mise à jour à la clôture de la barre
Pour qui c'est :
Les traders discrétionnaires et les constructeurs de systèmes semi-automatisés qui utilisent la confirmation multi-intervalle avant d'entrer en position, et qui souhaitent que cette vérification soit automatisée plutôt que manuelle.
Résumé
AI summary
Smart Trend Dashboard is a multi-timeframe indicator for cTrader that evaluates trend direction, momentum, and strength across four timeframes: M15, H1, H4, and D1. It provides a composite trend score ranging from -3 to +3 per timeframe, integrating EMA direction, DI+/DI- confirmation, and RSI momentum, while using ADX to filter out weak or choppy trends. The dashboard displays these scores visually with strength bars and color-coded panels (green for bullish, red for bearish, white for mixed), enabling quick assessment of market conditions without switching chart timeframes.
Key features include a live panel directly on the chart, ADX-gated scoring to reduce noise, full confluence detection that flags when all timeframes align, and sound alerts for complete bullish or bearish alignment. The indicator updates on bar close and does not repaint, making it suitable for discretionary traders and semi-automated system builders who rely on multi-timeframe confirmation before entering trades.
Key features include a live panel directly on the chart, ADX-gated scoring to reduce noise, full confluence detection that flags when all timeframes align, and sound alerts for complete bullish or bearish alignment. The indicator updates on bar close and does not repaint, making it suitable for discretionary traders and semi-automated system builders who rely on multi-timeframe confirmation before entering trades.
Profil de l'indicateur
Catégorie de l'indicateur
Tendance
Type de résultat
Visualisation
Signaux
Exigences en matière de données
Barres seulement
Signaux pris en charge
Puissance de la tendance
Avis clients
0.0
Avis : 0
Avis clients
Il n'y a pas encore d'avis sur ce produit. Vous l'avez déjà essayé ? Soyez le premier à en parler aux autres !
Discussion
Questions fréquentes
ADX
EMA
Supertrend
SMA
RSI
Moving Average
Les produits disponibles sur cTrader Store, notamment les bots de trading, les indicateurs et les plug-ins, sont fournis par des développeurs tiers et mis à disposition à titre informatif et à des fins d'accès technique uniquement. cTrader Store n'est pas un courtier et ne fournit aucun conseil en investissement, aucune recommandation personnelle ni aucune garantie quant aux performances futures.
Plus de cet auteur











![Logo de "Wyckoff Toolkit [Iridio Capital]"](https://cdn.ctrader.com/image/webp/5318c788-91ef-4297-bca6-4ce73b1516a8_61556)

![Logo de "[Hamster-Coder] Pivot Points MTF"](https://cdn.ctrader.com/image/webp/4c143e5a-309c-40e3-a578-f04d1e133ffa_31159)




Prix
Depuis le 30/05/2026
1
Ventes