
GUPPY-MASTER V3
Indicateur
251 téléchargements
Version 1.0, Mar 2026
Windows, Mac
5.0
Avis : 3
Depuis le 27/02/2026
33.16K
Volume tradé
25.96K
Pips gagnés
8
Ventes
391
Installations gratuites
Description
GUPPY TREND MASTER V3 (4X4 TRADING TECHNOLOGY )
Visualisez le sentiment du marché avec le Rainbow 38-EMA
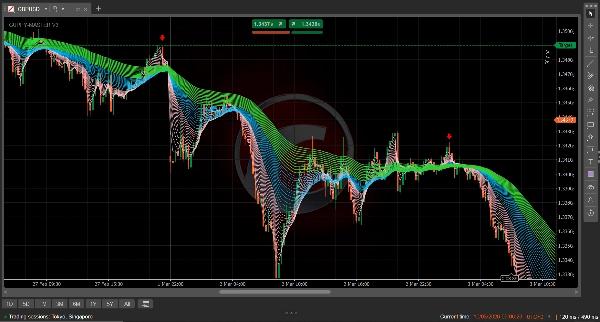
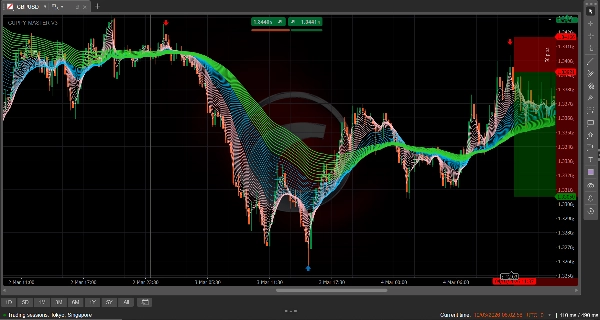
Le Guppy Trend Master 4X4 est un outil d'analyse technique premium pour cTrader qui transforme l'action des prix complexe en une carte claire et codée par couleur de la psychologie du marché. En traçant simultanément 38 moyennes mobiles exponentielles (EMA), il permet aux traders de distinguer le "bruit" temporaire des véritables retournements de tendance.
La logique visuelle 4X4
L'indicateur organise les données du marché en trois "rubans" distincts pour vous offrir une vue multidimensionnelle de la tendance :
- Le ruban rose (périodes 2–15) : Le groupe des "Spéculateurs". Ces lignes représentent les traders à court terme. Lorsqu'elles s'écartent, le momentum est élevé. Lorsqu'elles se compressent, le mouvement s'épuise.
- Le ruban bleu (périodes 17–41) : Le groupe "Pont". Il agit comme la zone de transition critique. Il sert souvent de zone de "rebond" pour une réentrée lors d'une forte tendance.
- Le ruban vert (périodes 44–74) : Le groupe des "Investisseurs". Il représente le sentiment à long terme. Un ruban vert large et évasé indique une tendance puissante et stable, difficile à briser.
Pourquoi utiliser cet indicateur ?
- Confirmation instantanée de la tendance : Voyez en un coup d'œil si le marché est en tendance ou en range. Si les rubans sont emmêlés, restez à l'écart. S'ils sont écartés et séparés, la tendance est forte.
- Zones de scalping précises : Spécialement optimisé pour les unités de temps M1 et M5, le 4X4 met en évidence avec une précision chirurgicale les zones "Acheter la baisse" et "Vendre la hausse".
- Visualisation de la volatilité : L'"écart" entre les rubans vous indique la conviction derrière un mouvement. Les "écarts clairs" (comme vus dans la logique 4X4) indiquent un environnement de trading à haute probabilité.
- Logique sans retard : En utilisant les moyennes mobiles exponentielles (EMA), le 4X4 réagit aux changements de prix plus rapidement que les indicateurs Guppy basés sur la SMA standard, ce qui le rend supérieur pour les marchés modernes à haute fréquence.
Comment lire le signal
- Force haussière : Le rose est en haut, suivi du bleu, avec le vert en bas. Tous les groupes s'évasent vers le haut avec un espace visible entre les lignes.
- Force baissière : Le vert est en haut, suivi du bleu, avec le rose en bas. Tous les groupes s'évasent vers le bas.
- La compression : Lorsque les trois groupes convergent en un seul point, une cassure massive est imminente.
Résumé
Résumé IA
The GUPPY TREND MASTER V3 is a technical analysis indicator designed for the cTrader platform that visualizes market sentiment using 38 Exponential Moving Averages (EMAs). It organizes these EMAs into three color-coded ribbons to provide a multi-dimensional view of market trends: the Pink Ribbon (periods 2–15) reflects short-term speculator activity, the Blue Ribbon (periods 17–41) serves as a transitional bridge zone, and the Green Ribbon (periods 44–74) indicates long-term investor sentiment. This structure helps traders distinguish between market noise and genuine trend reversals.
Key features include instant trend confirmation by observing ribbon separation or entanglement, precision scalping zones optimized for 1- and 5-minute timeframes, and visualization of market volatility through the spacing between ribbons. The use of EMAs ensures faster reaction to price changes compared to traditional SMA-based Guppy indicators, supporting high-frequency trading environments.
Signal interpretation is based on ribbon positioning and spacing: bullish trends show Pink above Blue above Green with upward fanning, bearish trends show the reverse with downward fanning, and convergence of all ribbons signals an imminent breakout. The indicator supports various markets including forex pairs (GBPUSD, USDJPY), cryptocurrencies, stocks, and commodities like gold (XAUUSD).
Profil de l'indicateur
Avis clients
5.0
Avis : 3
5 | 100 % | |
4 | 0 % | |
3 | 0 % | |
2 | 0 % | |
1 | 0 % |
Avis clients
March 29, 2026
This is a nice indicator 😀. Overall the images are what is represented on the chart no faking. But only the arrows missing. Let me hope version 2 has them.
March 17, 2026
Very good 👍👍 indicator. Have looked for it every where finally I found it works every well
Discussion
Questions fréquentes
Signal
Breakout
Scalping
GBPUSD
Crypto
Stocks
XAUUSD
NAS100
USDJPY
Les produits disponibles sur cTrader Store, notamment les bots de trading, les indicateurs et les plug-ins, sont fournis par des développeurs tiers et mis à disposition à titre informatif et à des fins d'accès technique uniquement. cTrader Store n'est pas un courtier et ne fournit aucun conseil en investissement, aucune recommandation personnelle ni aucune garantie quant aux performances futures.


![Logo de "[Stellar Strategies] Smart ADX"](https://cdn.ctrader.com/image/webp/af13b084-b6f6-41db-b7bc-c7e688b57b05_36929)


Prix
Depuis le 27/02/2026
33.16K
Volume tradé
25.96K
Pips gagnés
8
Ventes
391
Installations gratuites