Description
Le AdaptiveTrendChannel est un indicateur qui vous aide à visualiser les tendances du marché de manière plus claire et dynamique. 📈 Contrairement à une moyenne mobile classique, il s’adapte en temps réel à l’évolution du prix, vous permettant de voir quand la tendance change. 🔄
🛠️ Comment ça fonctionne ?
La première chose qu’il fait est de générer une ligne de référence dynamique qui se met à jour à chaque bougie. 🕯️ Considérez cette ligne comme un point d’équilibre, vous indiquant si le prix est dans une zone d’équilibre ou s’il évolue dans une direction claire.
Mais cette ligne ne fonctionne pas seule ! Elle s’appuie également sur des niveaux internes qui agissent comme des supports et résistances dynamiques. 💪 Ces niveaux s’ajustent constamment en fonction des plus hauts et plus bas récents 📉📈, ce qui signifie qu’ils ne sont pas fixes — ils s’adaptent aux conditions du marché en temps réel.
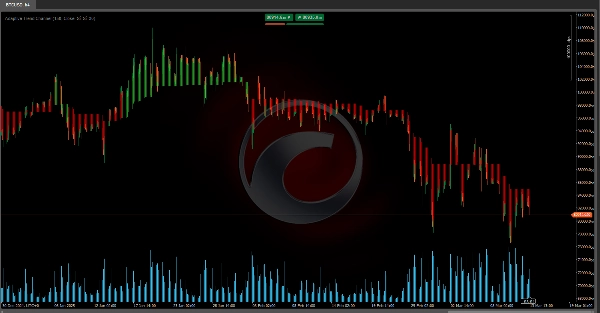
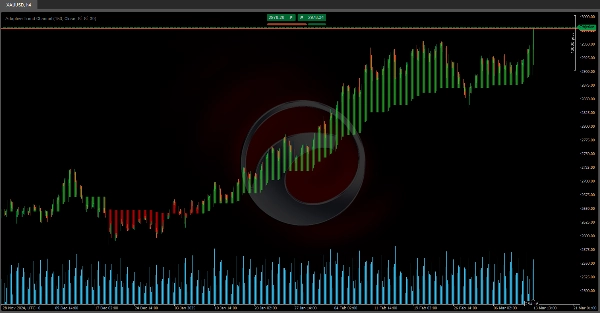
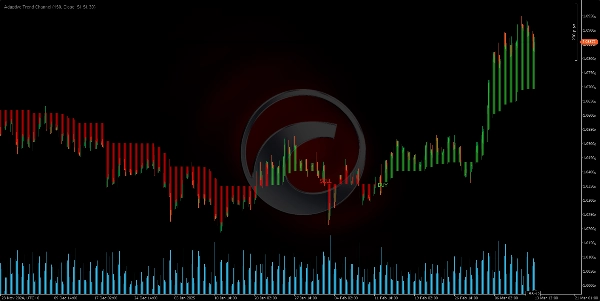
Lorsque le prix passe au-dessus ou en dessous de ces niveaux dynamiques, l’indicateur détecte un changement de tendance et génère des signaux. Pour rendre les choses encore plus claires, il colore la zone entre la ligne de référence et le prix de clôture, rendant les tendances visuellement évidentes. 🎨👀
📌 Comment l’utiliser en trading ?
Alors, comment l’appliquer dans des trades réels ? Facile.
✅ Si le prix reste au-dessus de la ligne de référence pendant plusieurs bougies, le marché est considéré comme haussier. 🟢
❌ Si le prix descend en dessous de la ligne de référence, le marché est considéré comme baissier. 🔴
Comme cette ligne s’ajuste dynamiquement et filtre le bruit du marché, elle vous offre une vue plus claire de la tendance.
De plus, l’indicateur suit les croisements récents :
🔻 Si le prix passe en dessous d’un niveau interne clé, cela signale une phase baissière potentielle.
🔺 Si le prix passe au-dessus d’un niveau interne clé, cela signale une phase haussière potentielle.
Avec ces informations, l’indicateur fait deux choses clés :
🎨 Change la couleur de la ligne et de la zone du graphique, vous donnant un indice visuel instantané sur la direction de la tendance.
📢 Génère des signaux d’achat/vente lorsqu’un changement de tendance est détecté.
🔥 Pourquoi est-il si puissant ?
Le AdaptiveTrendChannel vous aide à rester du bon côté de la tendance et à éviter de trader à contre-courant de la dynamique du marché. Il met en évidence des moments clés pour les points d’entrée et de sortie, vous offrant une référence visuelle claire pour des décisions de trading plus intelligentes.
Lorsqu’il est combiné avec d’autres outils comme l’analyse du volume ou l’action des prix, il devient un allié puissant pour filtrer les trades et améliorer la précision des entrées. 🚀💰
Indicateurs du Ctrader Store :
Dynamic Market Structure
Analysis of Turning Points
Fibonacci Linear
Regression Multi-timeframe
Multi-Level Candle Bias
Tracker
Auto Support and
Resistance Trend Lines
All Support and
Resistance Levels
Résumé
When the price moves above or below these adaptive levels, the indicator detects trend changes and produces buy or sell signals. It visually highlights trends by coloring the area between the reference line and the closing price, providing clear visual cues on trend direction. Traders can interpret price staying above the reference line as bullish and below it as bearish, with the indicator filtering out market noise for a cleaner trend view.
Additionally, the Adaptive Trend Channel tracks recent crossovers of key internal levels to signal potential bullish or bearish phases. It is intended to help traders stay aligned with market momentum and identify key entry and exit points. When combined with other tools like volume analysis or price action, it supports improved trade filtering and entry precision.
Avis clients
5 | 100 % | |
4 | 0 % | |
3 | 0 % | |
2 | 0 % | |
1 | 0 % |