
On Balance Volume
Indicateur
247 téléchargements
Version 1.0, Dec 2024
Windows, Mac
5.0
Avis : 1
Description
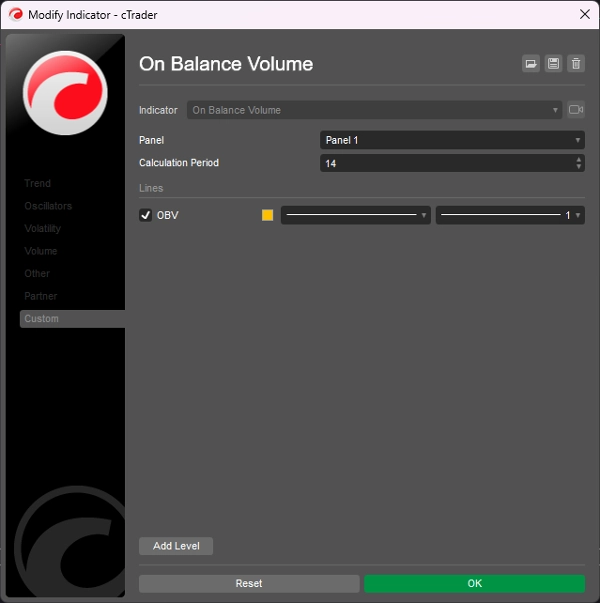
Le volume en balance (OBV) mesure la pression d'achat et de vente en tant qu'indicateur cumulatif qui ajoute le volume lors des jours haussiers et soustrait le volume lors des jours baissiers.
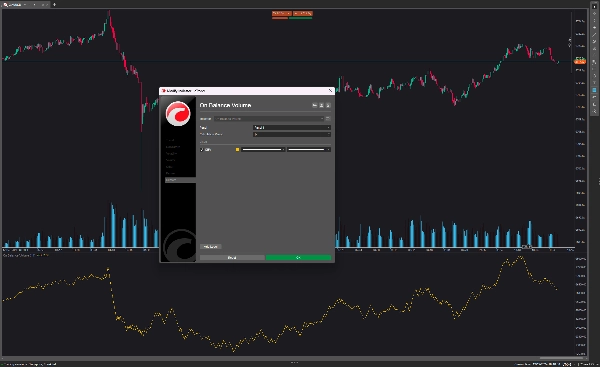
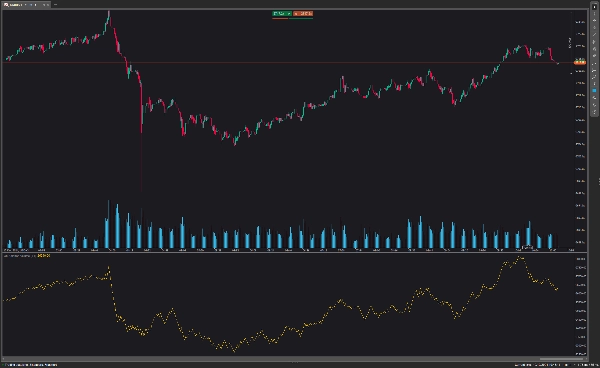
Le volume en balance est affiché en bas du graphique. La ligne OBV monte lorsque le prix de clôture d'aujourd'hui augmente et descend lorsque le prix de clôture d'hier est supérieur à celui actuel.
L'indicateur OBV identifie généralement une cassure avant que la ligne des prix ne le fasse et aide à établir une tendance haussière claire. Si vous souhaitez trader avec cette stratégie, vous ouvrez une position forex au niveau du prix de cassure et placez un stop loss au-dessus du dernier sommet récent.
Résumé
Résumé IA
On Balance Volume (OBV) is a technical indicator that measures buying and selling pressure by cumulatively adding volume on days when the closing price rises and subtracting volume on days when it falls. Displayed at the bottom of the chart, the OBV line moves upward when today's closing price exceeds the previous day's and moves downward when it is lower. This indicator is used to identify potential breakouts ahead of price movements and to confirm upward trends. Traders using OBV may open positions at breakout price levels and set stop losses above recent high swings. The indicator is applicable in forex markets and supports breakout trading strategies.
Profil de l'indicateur
Avis clients
5.0
Avis : 1
5 | 100 % | |
4 | 0 % | |
3 | 0 % | |
2 | 0 % | |
1 | 0 % |
Avis clients
August 18, 2025
Pros: A lightweight cumulative volume indicator that confirms price moves and detects divergences. Excellent for analyzing trend strength and sentiment. Cons: No alerts, tooltips, or template features. Signals may lag in volatile or manipulated markets.
Discussion
Questions fréquentes
Forex
Breakout
Les produits disponibles sur cTrader Store, notamment les bots de trading, les indicateurs et les plug-ins, sont fournis par des développeurs tiers et mis à disposition à titre informatif et à des fins d'accès technique uniquement. cTrader Store n'est pas un courtier et ne fournit aucun conseil en investissement, aucune recommandation personnelle ni aucune garantie quant aux performances futures.
Plus de cet auteur


![Logo de "[Stellar Strategies] Smart ADX"](https://cdn.ctrader.com/image/webp/af13b084-b6f6-41db-b7bc-c7e688b57b05_36929)


Prix
2
Ventes
6.9K
Installations gratuites