
Description
PMax (Profit Maximizer) est un tout nouvel indicateur développé par KivancOzbilgic au début de 2020.
C'est une combinaison de deux indicateurs de stop loss suiveur ;
L'un est l'indicateur MOST (Moving Stop Loss) d'Anıl Özekşi et l'autre est le bien connu SuperTrend basé sur l'ATR.
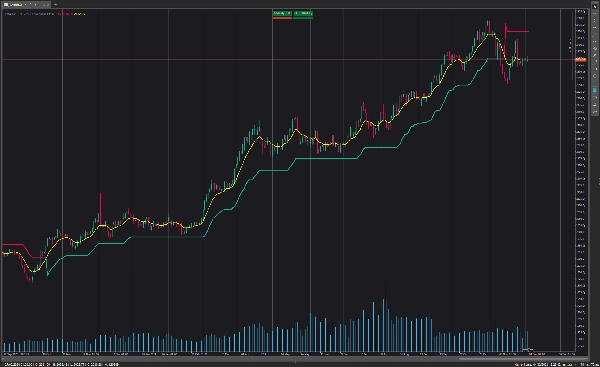
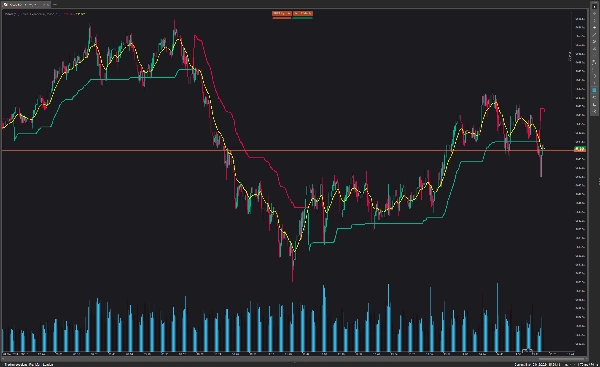
Les indicateurs MOST et SuperTrend sont très efficaces pour les systèmes de suivi de tendance mais, inversement, leur performance n'est pas brillante dans des conditions de marché latérales comme la plupart des autres indicateurs.
Profit Maximizer - PMax tente de résoudre ce problème. PMax combine les points forts de MOST (Moving Average Trend Changer) et SuperTrend (détection de prix ATR) en un seul indicateur.
Les résultats des backtests et de l'optimisation de PMax sont bien meilleurs comparés à ses prédécesseurs MOST et SuperTrend. Il réduit le nombre de faux signaux dans les marchés latéraux et fournit des signaux de trading plus fiables.
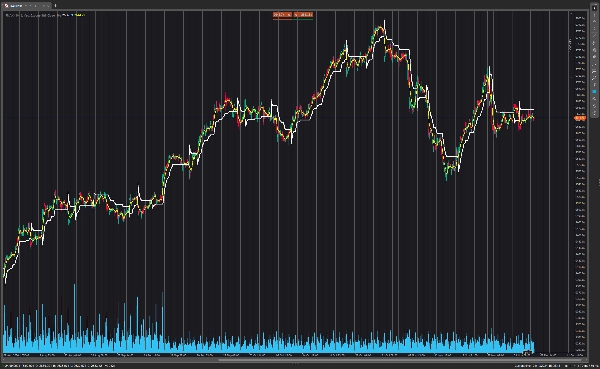
PMax facilite la détermination de la tendance et peut être utilisé sur tout type de marchés et d'instruments. Il ne se réajuste pas.
Résumé
This combination enhances trend identification and reduces false signals during non-trending market phases. Backtesting and optimization show that PMax outperforms its component indicators in reliability and signal accuracy. It is designed for use across various markets and instruments and does not repaint, providing consistent signals for traders.
Avis clients
5 | 100 % | |
4 | 0 % | |
3 | 0 % | |
2 | 0 % | |
1 | 0 % |


