
QQE
Indicateur
176 téléchargements
Version 1.0, Apr 2025
Windows, Mac
Description
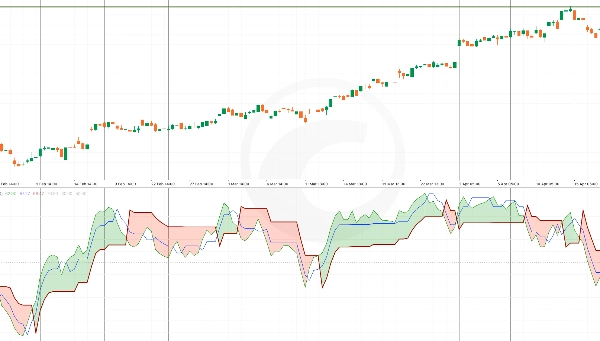
L'indicateur Quantitative Qualitative Estimation (QQE) est un outil d'analyse technique qui améliore le Relative Strength Index (RSI) en incorporant des moyennes mobiles lissées. Il aide les traders à évaluer la force de la tendance, les retournements potentiels et les conditions de surachat/survente avec une plus grande précision.
Le QQE comprend deux composants clés : les niveaux de stop suiveur rapide et lent, qui agissent comme des supports et résistances dynamiques. Cela en fait un outil polyvalent pour les stratégies de suivi de tendance et de retour à la moyenne. Un croisement entre la ligne QQE et sa ligne de signal indique souvent des opportunités potentielles d'achat ou de vente.
Résumé
Résumé IA
The Quantitative Qualitative Estimation (QQE) indicator is a technical analysis tool that enhances the Relative Strength Index (RSI) by integrating smoothed moving averages. It provides improved assessment of trend strength, potential reversals, and overbought or oversold market conditions. The indicator includes two main components: fast and slow trailing stop levels, which serve as dynamic support and resistance points. This design supports both trend-following and mean-reversion trading strategies. Additionally, crossovers between the QQE line and its signal line are used to identify potential buy or sell signals. The QQE indicator is applicable across various markets, including indices, and is categorized under momentum indicators.
Profil de l'indicateur
Avis clients
0.0
Avis : 0
Avis clients
Il n'y a pas encore d'avis sur ce produit. Vous l'avez déjà essayé ? Soyez le premier à en parler aux autres !
Discussion
Questions fréquentes
Signal
Indices
RSI
Les produits disponibles sur cTrader Store, notamment les bots de trading, les indicateurs et les plug-ins, sont fournis par des développeurs tiers et mis à disposition à titre informatif et à des fins d'accès technique uniquement. cTrader Store n'est pas un courtier et ne fournit aucun conseil en investissement, aucune recommandation personnelle ni aucune garantie quant aux performances futures.


Prix
12
Ventes
421
Installations gratuites