
FAMA-MAMA
Indicateur
Version 1.0, May 2025
Windows, Mac
5.0
Avis : 1
Description
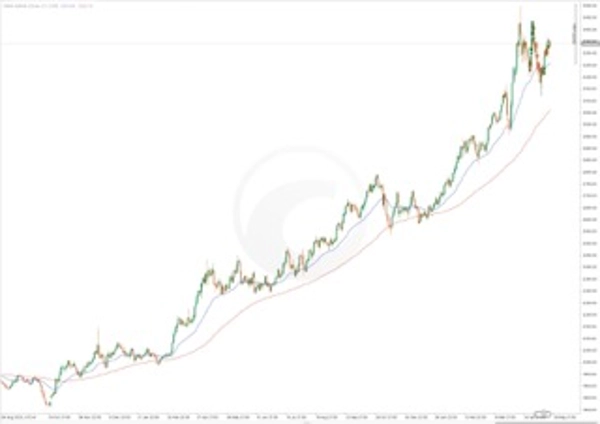
L’indicateur FAMA-MAMA est un outil de tendance dynamique et adaptatif conçu pour les traders qui ont besoin d’une meilleure compréhension de la direction du marché. Basé sur la moyenne mobile adaptative MESA (MAMA) et sa ligne compagnon (FAMA), cet indicateur s’ajuste aux conditions changeantes du marché pour mettre en évidence les changements de tendance et réduire le bruit sur le graphique.
Points forts :
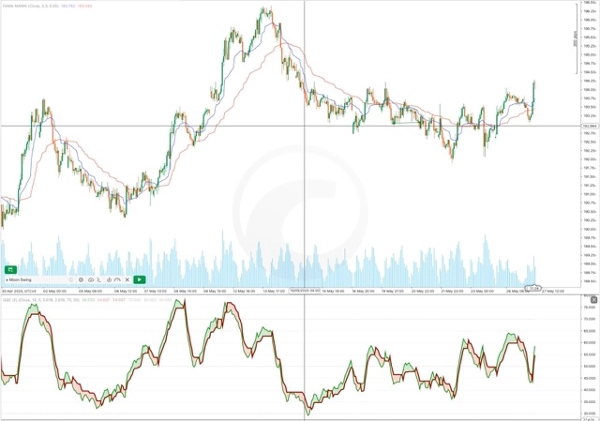
- Lignes de tendance adaptatives : MAMA s’adapte aux cycles du marché, ce qui le rend plus réactif en conditions de tendance et plus lisse en phases de consolidation.
- Signaux de croisement clairs : Les signaux d’achat et de vente sont générés lorsque MAMA croise FAMA.
- Paramètres personnalisables : Modifiez les couleurs, les styles de ligne et la sensibilité pour adapter l’indicateur à votre stratégie et à vos préférences visuelles.
- Intégration visuelle : S’affiche directement sur votre graphique pour une reconnaissance facile des signaux.
Logique des signaux :
- Lorsque MAMA croise au-dessus de FAMA → momentum haussier
- Lorsque MAMA croise en dessous de FAMA → momentum baissier
Adapté à plusieurs styles de trading, y compris le trading intraday et le swing trading, cet indicateur aide les traders à suivre les tendances du marché avec clarté et confiance.
Résumé
Résumé IA
The FAMA-MAMA Indicator is an adaptive trend-following tool designed to provide clearer insight into market direction. It is based on the MESA Adaptive Moving Average (MAMA) and its companion line, FAMA. This indicator dynamically adjusts to changing market conditions, enhancing responsiveness during trending phases and smoothing out noise in ranging markets.
Key features include:
- Adaptive trend lines that respond to market cycles.
- Clear buy and sell signals generated when MAMA crosses above or below FAMA, indicating upward or downward momentum respectively.
- Customizable settings allowing users to modify colors, line styles, and sensitivity to align with their trading strategies and visual preferences.
- Direct chart integration for straightforward signal recognition.
Suitable for various trading styles such as intraday and swing trading, the FAMA-MAMA Indicator assists traders in tracking market trends with improved clarity and confidence.
Profil de l'indicateur
Avis clients
5.0
Avis : 1
5 | 100 % | |
4 | 0 % | |
3 | 0 % | |
2 | 0 % | |
1 | 0 % |
Discussion
Questions fréquentes
Signal
Les produits disponibles sur cTrader Store, notamment les bots de trading, les indicateurs et les plug-ins, sont fournis par des développeurs tiers et mis à disposition à titre informatif et à des fins d'accès technique uniquement. cTrader Store n'est pas un courtier et ne fournit aucun conseil en investissement, aucune recommandation personnelle ni aucune garantie quant aux performances futures.


![Logo de "[Hamster-Coder] Moving Average MTF"](https://cdn.ctrader.com/image/webp/b11b98b1-194d-4b8e-b00e-d611826ad159_31226)


Prix
12
Ventes
421
Installations gratuites