
Description
MFI-MTF : Indice de Flux Monétaire Multi-Temps
Présentation
MFI-MTF est un indicateur de momentum multi-temporel qui apporte une perspective de timeframe supérieure à votre graphique actuel. En calculant l'Indice de Flux Monétaire (MFI) sur un timeframe plus large et en l'affichant sur votre graphique de travail, cet indicateur vous aide à identifier les conditions de surachat et de survente à travers plusieurs perspectives de marché sans avoir à changer manuellement de timeframe.
Ce qu'il fait
Analyse de l'Indice de Flux Monétaire : L'indicateur mesure la pression d'achat et de vente en analysant à la fois le mouvement des prix et le volume des échanges. Il oscille entre 0 et 100, identifiant quand un actif a subi une pression d'achat excessive (surachat) ou de vente excessive (survente).
Contexte de Timeframe Supérieur : Plutôt que de calculer le MFI sur le timeframe de votre graphique actuel, MFI-MTF extrait les données d'un timeframe plus large que vous spécifiez (quotidien, hebdomadaire, 4 heures, etc.). Cela vous donne des insights de momentum au niveau institutionnel sans le bruit des timeframes inférieurs. Par exemple, lorsque le MFI quotidien montre des conditions de surachat, vous savez que la tendance plus large atteint son épuisement — un contexte précieux pour les décisions d'entrée et de sortie.
Filtre Moyenne Mobile Hull : Une Moyenne Mobile Hull (HMA) appliquée au MFI lisse les faux signaux et met en évidence les changements de momentum directionnel. Des points verts marquent les tendances haussières du momentum, tandis que des points rouges marquent les tendances baissières, vous offrant une confirmation visuelle rapide des changements de direction du momentum.
Principaux Résultats
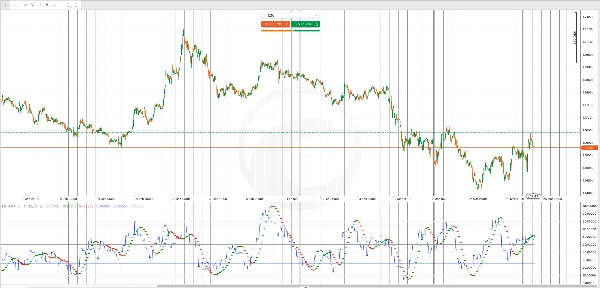
Ligne MFI (Bleu) : La valeur principale de l'Indice de Flux Monétaire de votre timeframe supérieur sélectionné, affichée sur chaque barre de votre graphique actuel.
Signaux HMA (Points Verts/Rouges) : Des points verts apparaissent lorsque le momentum se renforce à la hausse ; des points rouges apparaissent lorsque le momentum faiblit ou s'inverse à la baisse. Ceux-ci servent de signaux d'alerte précoce pour des retournements potentiels.
Niveaux de Référence :
- Niveau de Surachat (par défaut 70) : Lorsque le MFI dépasse ce niveau, la pression d'achat est excessive et les retournements deviennent probables
- Niveau de Survente (par défaut 30) : Lorsque le MFI descend en dessous de ce niveau, la pression de vente est épuisée et les rebonds deviennent probables
- Ligne Médiane (50) : Le point d'équilibre neutre entre momentum haussier et baissier
Personnalisation
Sélection du Timeframe : Choisissez n'importe quel timeframe supérieur à celui de votre graphique actuel (quotidien sur un graphique horaire, par exemple). Les timeframes plus larges fournissent un contexte de tendance plus large mais des signaux moins fréquents ; les incréments plus petits offrent plus d'opportunités de trading mais avec une perspective stratégique moindre.
Période MFI : Ajustez la période de retour en arrière pour l'Indice de Flux Monétaire (par défaut 14). Les périodes plus courtes rendent l'indicateur plus réactif aux changements récents de volume ; les périodes plus longues lissent la volatilité et réduisent les faux signaux.
Période HMA : Contrôlez le lissage du filtre de momentum. Les périodes plus courtes rendent les changements de tendance plus évidents mais plus bruyants ; les périodes plus longues confirment les tendances plus fiablement mais avec une génération de signal plus lente.
Seuils Surachat/Survente : Personnalisez ces niveaux pour correspondre à votre style de trading. Les traders conservateurs peuvent utiliser 75/25 ; les traders agressifs peuvent utiliser 80/20 pour attendre des conditions plus extrêmes.
Utilisation Pratique
Utilisez MFI MTF pour ajouter de la confluence à vos entrées et sorties. Un signal de vente sur votre timeframe de travail devient plus fiable si le MFI quotidien est déjà en surachat, indiquant que les vendeurs institutionnels sont probablement actifs. De même, les signaux d'achat gagnent en force lorsque le MFI du timeframe supérieur est en survente, montrant que la pression de vente a été épuisée au niveau macro.
Les changements de couleur de la HMA vous donnent des alertes en temps réel sur les changements de momentum, vous aidant à sortir tôt des trades perdants ou à réduire la taille de la position avant que les retournements ne deviennent sévères.
Résumé
The indicator includes a Hull Moving Average (HMA) filter applied to the MFI to smooth out noise and highlight momentum shifts. Green dots indicate strengthening upward momentum, while red dots signal weakening or downward momentum. Reference levels include default overbought (70), oversold (30), and a neutral midpoint (50), all customizable to fit different trading styles.
Key outputs are the MFI line from the chosen higher timeframe and HMA signals for momentum direction changes. Adjustable parameters include the MFI lookback period, HMA smoothing period, and overbought/oversold thresholds. MFI-MTF aids in confirming entry and exit points by providing institutional-level momentum insights and real-time alerts to momentum shifts on your working chart.
Avis clients
5 | 100 % | |
4 | 0 % | |
3 | 0 % | |
2 | 0 % | |
1 | 0 % |


