
Description
🌟 **Qu'est-ce que le Z-Score ?** 🌟
• **Z-Score en trading** : C’est une façon de mesurer à quelle distance le prix actuel se trouve de sa moyenne récente, exprimée en termes d’écarts-types. 😊 Une valeur proche de 0 indique que le prix est proche de sa moyenne, tandis que des valeurs élevées (positives ou négatives) 😮 indiquent qu’il s’en est significativement écarté.
• **Utilité statistique** : Ces valeurs permettent d’identifier des situations où le prix est « suracheté » 📈 ou « survendu » 📉, ce qui peut être utile pour des stratégies de retour à la moyenne ou pour détecter des moments de forte volatilité 💥.
🌟 **Comment fonctionne l’indicateur** 🌟
1. **Calcul de la moyenne et de l’écart** :
- Un nombre spécifique de barres (ou périodes) précédentes est analysé pour calculer le prix de clôture moyen et son écart-type. 🧮
- Avec ces valeurs, on détermine à quel point le prix actuel s’écarte de la moyenne. Cette différence est exprimée sous forme de Z-Score.
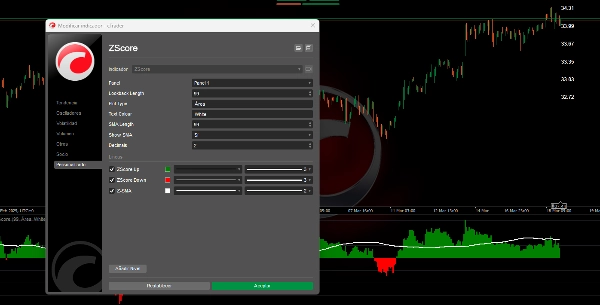
2. **Visualisation du Z-Score** :
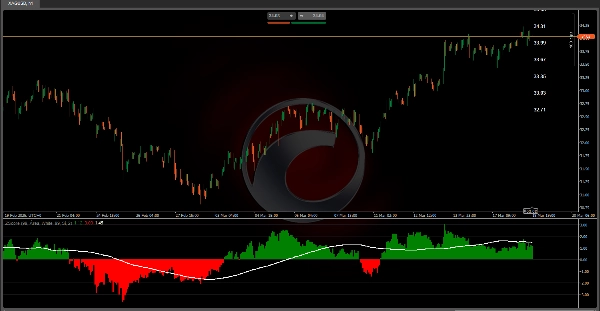
- **Mode zone** : Deux histogrammes sont affichés : un en vert 🟩 pour les valeurs positives (lorsque le prix est au-dessus de la moyenne) et un autre en rouge 🔴 pour les valeurs négatives (lorsqu’il est en dessous). Cela permet d’identifier visuellement l’amplitude et la direction de l’écart.
3. **Moyenne mobile du Z-Score** :
- Une moyenne mobile est calculée sur les valeurs du Z-Score. Cela aide à lisser les fluctuations et à identifier les tendances dans le comportement de l’écart du prix au fil du temps. 📊
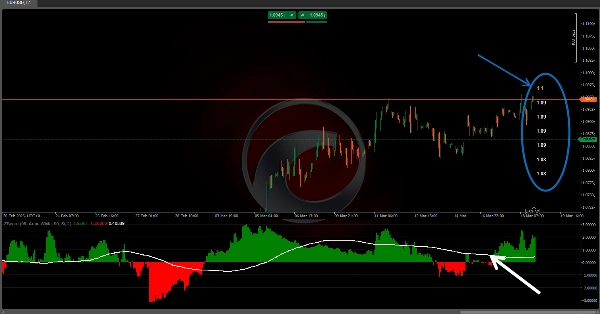
4. **Zones de probabilité et étiquettes de référence** :
- De plus, des étiquettes sont placées sur le graphique montrant les prix correspondant à la moyenne et à chaque niveau d’écart. Cela est utile pour comprendre, en termes de prix, à quel point le marché se comporte de manière « extrême ». ⚠️
---
🌟 **Interprétation et application pour les traders** 🌟
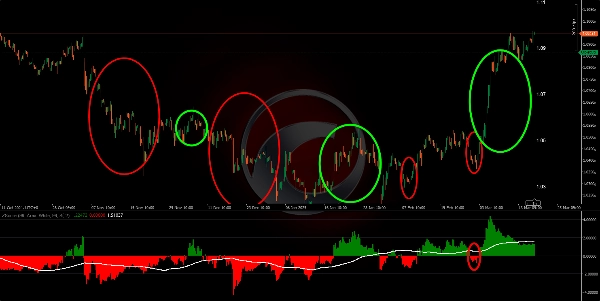
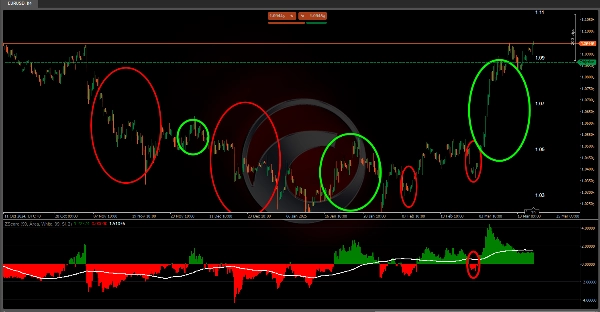
• **Détection des extrêmes** : En observant des valeurs très hautes ou très basses dans l’indicateur, un trader peut identifier que le prix s’est significativement éloigné de sa moyenne. Cela peut suggérer qu’une correction est probable (si on attend un retour à la moyenne) 🔄 ou qu’une forte cassure est en cours.
• **Confirmation de tendance** : La moyenne mobile du Z-Score et les bandes associées permettent de voir les changements dans la tendance du comportement du prix par rapport à sa moyenne. Un croisement ou un changement de ces lignes peut être interprété comme un signal d’entrée 🛡️ ou de sortie.
• **Gestion des risques** : En connaissant les niveaux d’écart et les zones de probabilité, vous pouvez ajuster la taille des positions ou définir des points de stop loss ⬇️ et take profit ⬆️, car vous disposez d’une référence pour les mouvements normaux versus extrêmes.
• **Compréhension statistique du marché** : Au-delà d’être un simple outil graphique, cet indicateur encourage à penser le comportement du marché en termes probabilistes. Connaître la « normalité » d’un mouvement peut être un facteur décisif lors de l’évaluation des opportunités de trading. 🎯
🌟 **Conclusion** 🌟
Cet algorithme convertit les données de prix en une représentation statistique qui aide à visualiser et quantifier l’écart du prix par rapport à son comportement récent. En combinant le Z-Score, une moyenne mobile, des bandes d’écart et un tableau de probabilité, l’indicateur fournit plusieurs couches d’informations. Cela le rend particulièrement précieux pour identifier les moments où le marché est dans des conditions inhabituelles, facilitant les décisions d’entrée 🚀, de sortie 🛑 et de gestion des risques basées sur la probabilité et les statistiques. 📈📉
Indicateurs du Ctrader Store :
Dynamic Market Structure
Analysis of Turning Points
Fibonacci Linear
Regression Multi-timeframe
Multi-Level Candle Bias
Tracker
Auto Support and
Resistance Trend Lines
Résumé
Avis clients
5 | 100 % | |
4 | 0 % | |
3 | 0 % | |
2 | 0 % | |
1 | 0 % |


![Logo de "Gaussian Channel [Iridio Capital]"](https://cdn.ctrader.com/image/webp/7c039209-5573-4a54-a072-f9528b503103_41960)


