Description
Un indicateur qui devient un système de trading
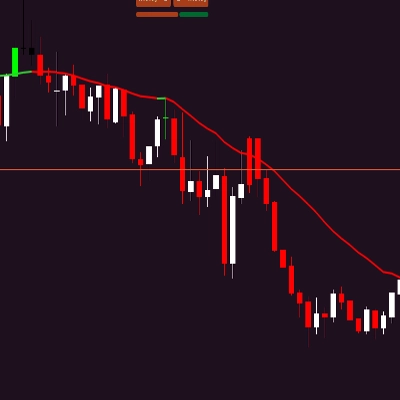
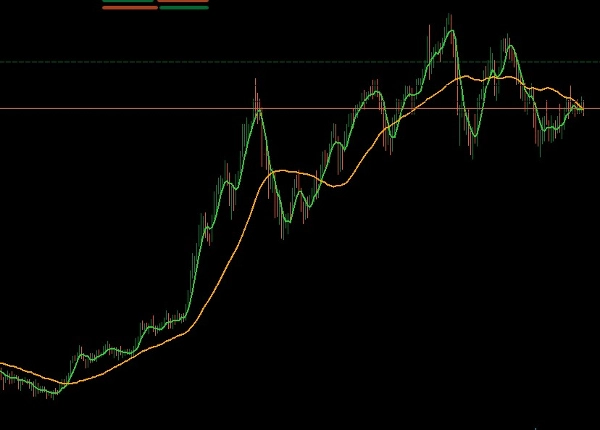
Cet indicateur, lorsqu'il est utilisé sur un graphique hebdomadaire, peut en effet devenir un système de trading complet. Sa principale force est qu'il filtre le bruit du marché typique des périodes plus courtes, ne vous montrant que la direction clé à long terme.
Une stratégie de trading basée sur la tendance
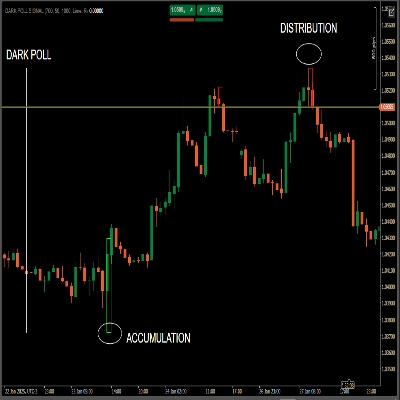
La condition principale de succès est la capacité du trader à identifier la fin d'un mouvement latéral (consolidation). Lorsqu'un instrument sort enfin de cette période d'incertitude et que l'indicateur pointe avec confiance vers une nouvelle direction, c'est le moment parfait pour entrer sur le marché.
Puisque la transaction est effectuée sur un graphique hebdomadaire, elle vise à capturer une tendance majeure. En conséquence, un trader patient qui entre précisément sur le marché au début d'une tendance peut réaliser un très bon profit à partir d'une seule transaction. Cet indicateur se transforme d'un simple outil en la base d'une stratégie de trading simple mais puissante pour ceux qui sont prêts à attendre et à trader les grandes tendances.
Résumé
Avis clients
5 | 0 % | |
4 | 100 % | |
3 | 0 % | |
2 | 0 % | |
1 | 0 % |