
Description
📌 CandleColourFlow_EURCAD_DEMO_1_1 – Version Démo (MISE À JOUR)
CandleColourFlow est un indicateur innovant conçu pour mettre en évidence clairement et rapidement la direction de la tendance et la force de l'élan sur le marché Forex.
La version EURCAD Demo 1.1 (Mise à jour) propose un coloriage des chandeliers amélioré qui aide à identifier les impulsions, les ralentissements et les zones neutres avec une grande clarté visuelle.
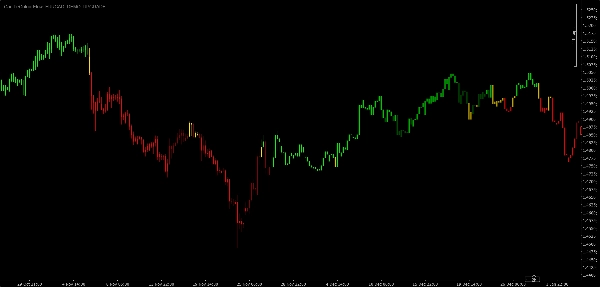
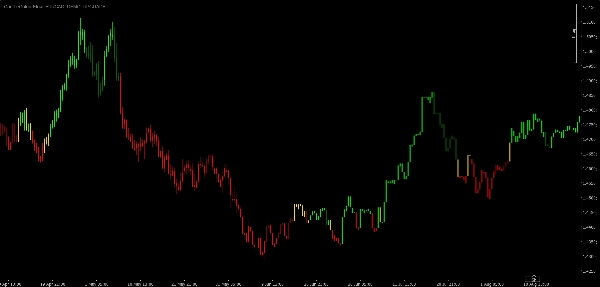
🔹 Système de Couleur des Chandeliers (Version Démo)
Vert Clair – forte impulsion haussière
Indique une domination claire des acheteurs et soutient la tenue ou l'ouverture de positions longues.
Vert Foncé – tendance haussière en affaiblissement
L'élan faiblit.
Cela peut signaler une opportunité de sortie potentielle après un mouvement haussier soutenu.
Rouge Clair – forte impulsion baissière
La pression vendeuse est dominante et favorise la poursuite des positions courtes.
Rouge Foncé – tendance baissière en affaiblissement
L'élan perd de la force.
Cela peut indiquer une fin possible du mouvement, propice à la fermeture des positions courtes.
Chandeliers Dorés – marché neutre
Pas d'avantage directionnel clair.
Apparaît souvent lors de consolidations ou d'une pause avant la reprise.
💡 Qu'est-ce qui rend CandleColourFlow Demo 1.1 unique ?
- Évaluation visuelle instantanée de la force de la tendance (couleurs claires vs foncées)
- Aide les traders à évaluer rapidement les conditions du marché sans plusieurs indicateurs
- Simple et intuitif pour les débutants
- Version démo épurée, sans distractions
⚠️ Avertissement légal
Cet indicateur est destiné à des fins éducatives uniquement.
Il ne constitue pas un conseil financier ni une recommandation d'exécuter des transactions.


