Description
Canaux de régression statistique avec niveaux de Fibonacci à travers plusieurs types de calcul, périodes et plages de dates.
Ajuste des lignes de régression à travers les données de prix en utilisant huit méthodes (Linéraire, Logarithmique, Exponentielle, Pondérée, Polynômiale, Mobile, Moyenne Mobile Exponentielle, LOWESS) avec des bandes d'écart-type pour l'analyse de la réversion à la moyenne.
Neuf niveaux de canal Fibonacci (0% à 100%), analyse multi-périodes sur 16 périodes avec rendu interpolé, trois modes de calcul (Basé sur la période, Plage de dates, MTF), contrôle du degré polynômial (1-5) pour des structures de tendance courbées, multiplicateur d'écart-type pour l'ajustement de la largeur du canal, analyse de date-heure sensible au fuseau horaire pour l'analyse d'événements, projection de ligne de tendance étendue à l'infini, et mise en cache LRU optimisée offrant une analyse complète de la régression statistique pour les traders ciblant les zones de réversion à la moyenne et les structures de prix courbées dans diverses conditions de marché.
FONCTIONNALITÉS
8 Types de calcul de régression
- Linéaire : Régression linéaire classique des moindres carrés
- Logarithmique : Régression basée sur le logarithme naturel pour les mouvements exponentiels des prix
- Exponentielle : Ajustement de courbe exponentielle pour les tendances accélérées
- Pondérée : Régression linéaire avec un poids plus important sur les barres récentes
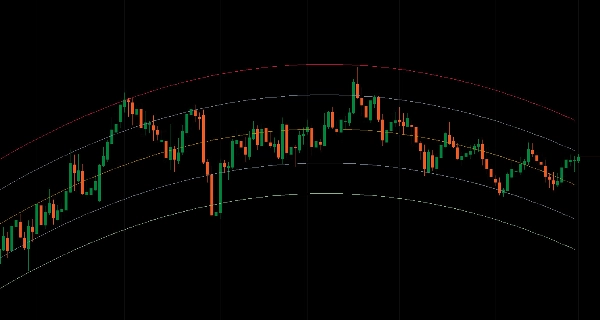
- Polynomiale : Ajustements courbés (degré 1-5) pour les tendances non linéaires
- Mobile : Régression basée sur la moyenne mobile
- Moyenne Mobile Exponentielle : Régression basée sur EMA pour lisser la tendance
- LOWESS : Régression localement pondérée pour un lissage adaptatif
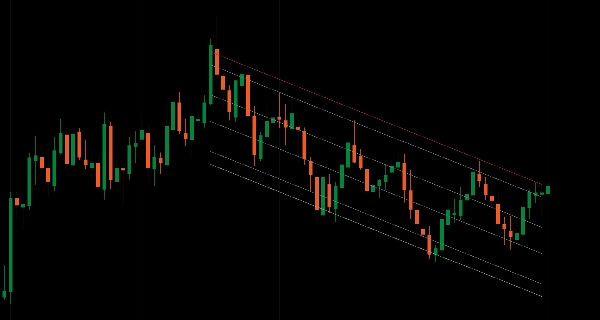
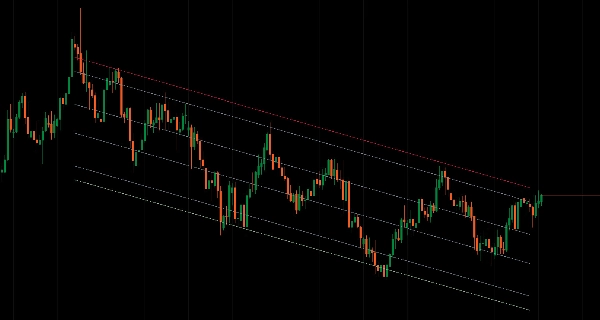
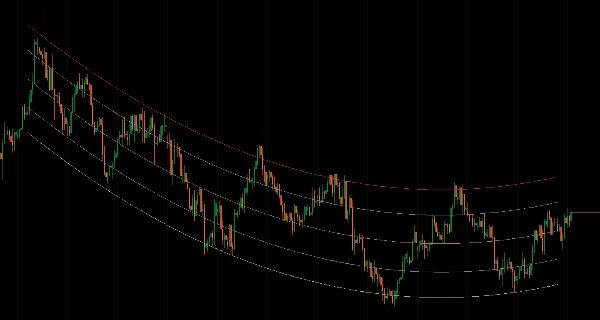
9 Niveaux de canal Fibonacci
- Plage complète du canal : 100% (supérieur), 88,6%, 76,4%, 61,8%, 50% (ligne médiane), 38,2%, 23,6%, 11,4%, 0% (inférieur)
- Zones de réversion à la moyenne dans les bandes de régression
- Points de référence précis de support/résistance
- Contrôle indépendant de la couleur/style/épaisseur pour chaque niveau
Analyse Multi-Périodes
- Calculer la régression sur une période supérieure, afficher sur le graphique actuel
- 16 périodes disponibles (m1 à Mensuel)
- Valeurs de canal interpolées pour un rendu fluide à travers les barres du graphique
- Structure de période supérieure sans changer de graphique
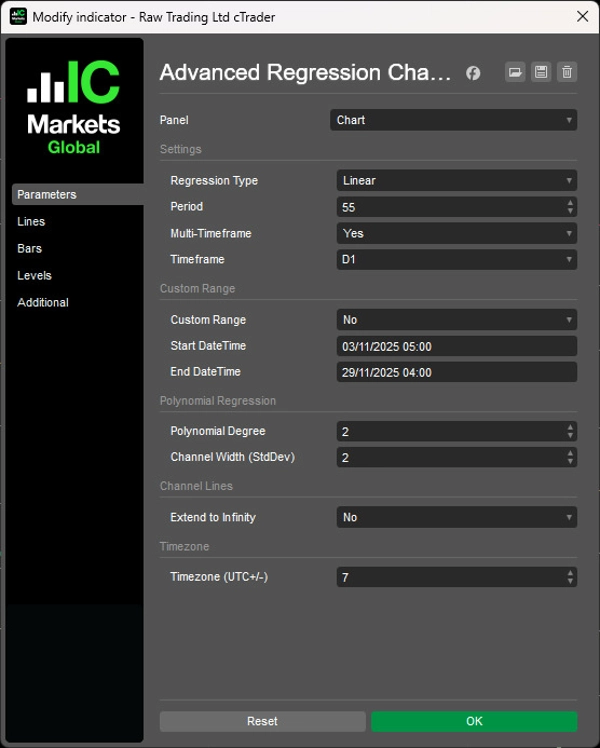
3 Modes de calcul
- Basé sur la période : Fenêtre glissante de N barres (par défaut)
- Plage de dates : Date/heure de début/fin personnalisée pour des événements ou phases spécifiques avec analyse de date-heure sensible au fuseau horaire (décalage UTC+/-)
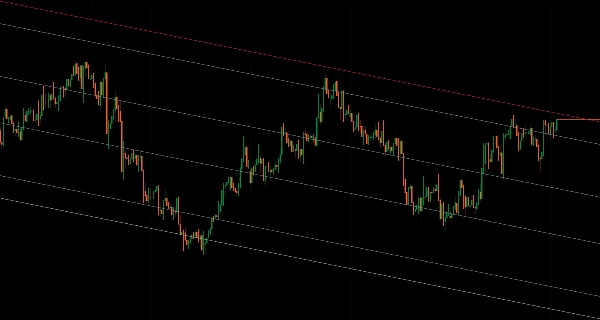
Options d'affichage du canal
- Sortie standard : Tracer les 9 niveaux comme lignes d'indicateur
- Extension à l'infini : Rendu sous forme de lignes de tendance projetées indéfiniment vers l'avant
- Rafraîchissement automatique lors du changement de couleurs/styles
- Rendu propre — pas de valeurs résiduelles au-delà de la fenêtre de calcul
Mode Plage de Dates
- Définir les dates exactes de début/fin (format jj/MM/aaaa HH:mm)
- Analyser des événements, phases ou structures de marché spécifiques
- Indépendant du paramètre de période
- Conversion de fuseau horaire de l'heure locale de l'utilisateur à l'heure du serveur
Calcul Dynamique
- Mises à jour en temps réel à mesure que de nouvelles barres se forment
- Mise en cache LRU optimisée avec suivi de plage sale
- Dimensionnement adaptatif du cache basé sur la période
- Recherche binaire pour des recherches rapides dans la plage de dates
Contrôle de la largeur du canal
- Multiplicateur d'écart-type (par défaut 2.0)
- Bandes plus larges pour l'expansion de la volatilité
- Bandes plus serrées pour les marchés en range
- Cohérent à travers tous les types de régression
Régression polynomiale
- Contrôle du degré : 1-5 (plus élevé = plus de courbure)
- Capture les tendances non linéaires
- Utile pour les structures de prix paraboliques ou courbées
- Retour à la linéarité lorsque le degré = 1
Gestion visuelle propre
- Pas de calcul sur la barre en formation — uniquement sur les barres complètes
- Tronquage multi-périodes approprié — les lignes se terminent à la dernière barre HTF complétée
- Extrapolation basée sur la pente pour une projection directionnelle cohérente
- Série de sortie claire avec noms descriptifs des niveaux
__________________________________________________________________________________________
PLUS D'INDICATEURS GRATUITS
Explorez une large gamme d'outils d'analyse de marché — de la structure et du volume à la régression, la volatilité et les périodes personnalisées.
Le code source est disponible sur le dépôt GitHub.
Tous gratuits à utiliser. Mais si vous souhaitez offrir un café en soutien, vous pouvez le faire ici.
Support/Résistance
Volume
- Profileur d'Activité de Volume
- Analyseur d'Efficacité du Volume
- Analyse du Profil de Volume
- Profil de Volume - Mis à jour
- Analyse de la Répartition du Volume
- VWAP (Prix Moyen Pondéré par le Volume)
Moyennes Mobiles
- Canal SSL
- Moyenne Mobile Ancrée
- Moyenne Mobile Échelonnée par Déviation
- Activateur Haut Bas de Gann
- Ligne de Tendance Instantanée
- MA Adaptative de Kaufman avec Vision de Tendance
- Canal de Moyenne Mobile
- Suite de Moyennes Mobiles
- Moyenne Mobile du Canal de Tendance
Utilitaires/Personnalisés
Basé sur la Régression
Volatilité
Oscillateurs
__________________________________________________________________________________________
AVERTISSEMENT
Le trading comporte des risques. Cet indicateur est destiné uniquement à l'analyse technique — appliquez toujours une gestion des risques appropriée et tradez de manière responsable.
RETROACTION & AMÉLIORATIONS
Si vous avez des suggestions, des demandes de fonctionnalités ou des idées d'amélioration, veuillez laisser un commentaire dans l'onglet Discussion. Vos retours aident à améliorer l'indicateur pour tout le monde.
Résumé
It offers multi-timeframe analysis across 16 periods (from 1 minute to monthly), enabling regression calculations on higher timeframes displayed on the current chart with smooth interpolated rendering. Users can select among three calculation modes: Period-Based (rolling window), Date Range (custom start/end with timezone-aware parsing), and Multi-Timeframe. Channel width is adjustable via a standard deviation multiplier to reflect market volatility.
The indicator features real-time dynamic updates, optimized caching for performance, and extend-to-infinity trendline projections for forward-looking analysis. Visual output is clean, with slope-based extrapolation and no calculations on forming bars. This tool is designed for traders analyzing mean reversion and complex price structures across various market conditions.