说明
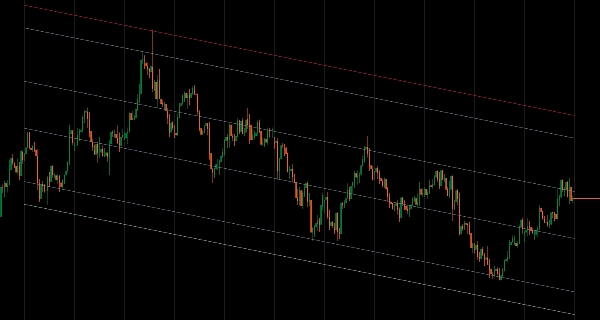
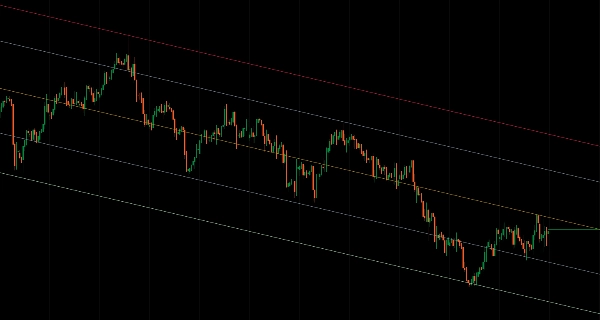
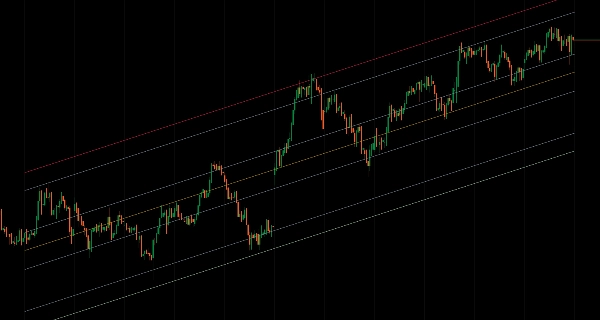
具有灵活计算模式和基于偏差带渲染的统计价格通道。
使用周期模式(最近N根K线)、日期时间模式(从特定日期开始)或锁定机制,在价格持续变化时冻结历史点的分析,拟合价格数据的回归线。
三种偏差方法(平均、独立、最大)用于对称和非对称通道,六个斐波那契回撤水平(11.4%至88.6%),多时间框架分析,六种价格类型(开盘/最高/最低/收盘/中位/典型),仅历史模式用于稳定回测,以及无限延伸投影,为交易者提供全面的回归分析,帮助定位均值回归区域和统计价格边界,适应各种市场条件。
功能特点
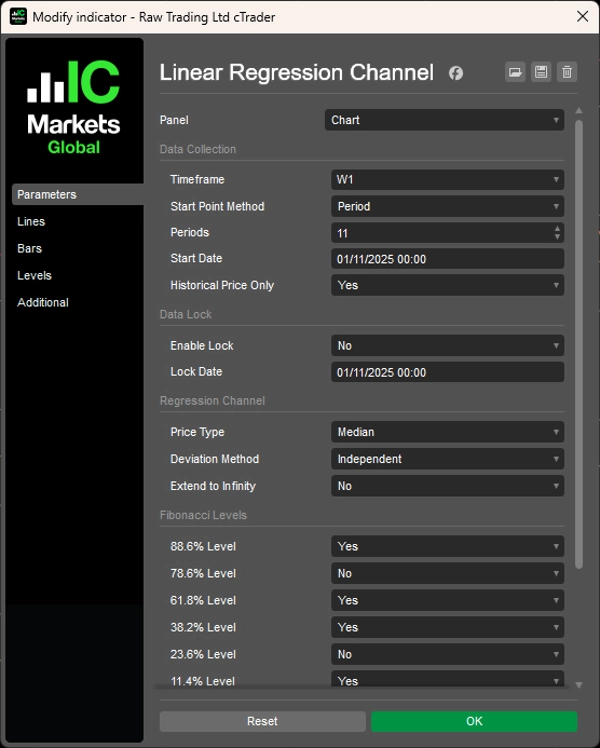
灵活的数据选择
- 周期模式:分析最近N根K线(例如,最近12个月的月线)
- 日期时间模式:从特定市场事件或日期开始
- 锁定机制:在价格继续变化时冻结历史分析点
- 多时间框架:在当前图表上从任意时间框架绘制回归线
智能偏差方法
- 平均:使用均值偏差的平衡水平——理想的交易区间
- 独立:适应方向性波动的非对称通道
- 最大:显示极端价格边界,进行全范围分析
专业分析工具
- 6个斐波那契回撤水平(11.4%、23.6%、38.2%、61.8%、78.6%、88.6%)
- 6种价格类型:开盘、最高、最低、收盘、中位、典型
- 仅历史模式:排除形成中的K线以实现稳定回测
- 无限延伸选项用于长期预测
完全自定义
- 所有通道元素的完整颜色自定义
- 回归线和偏差带的独立控制
- 清晰的视觉呈现,便于专注分析
高级功能
- 基于事件的分析研究锁定功能
- 结合高时间框架结构与低时间框架执行
- 适应不同市场条件的对称和非对称通道选项
__________________________________________________________________________________________
更多免费指标
探索广泛的市场分析工具——从结构和成交量到回归、波动率和自定义时间框架。
源代码可在GitHub 仓库中获取。
全部免费使用。但如果您愿意支持咖啡费用,可以通过 这里进行捐助。
支撑/阻力
成交量
移动平均线
实用工具/自定义
基于回归
波动率
振荡器
__________________________________________________________________________________________
免责声明
交易存在风险。此指标仅用于技术分析——请始终应用适当的风险管理并负责任地交易。
反馈与改进
如果您有建议、功能请求或改进想法,请在讨论标签页留言。您的反馈有助于为所有人改进该指标。
摘要
客户评价
5 | 100 % | |
4 | 0 % | |
3 | 0 % | |
2 | 0 % | |
1 | 0 % |