
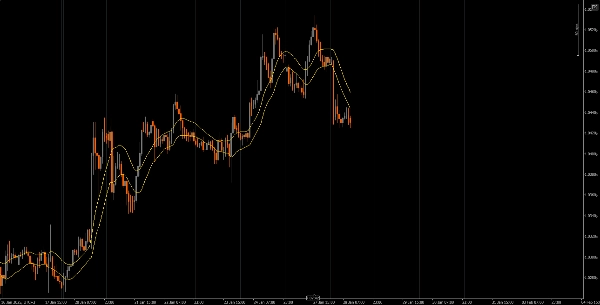
图表上的可自定义移动平均线(MAs),使用不同类型的移动平均线(简单、加权、指数)和价格数据源(收盘价、开盘价、最高价、最低价)
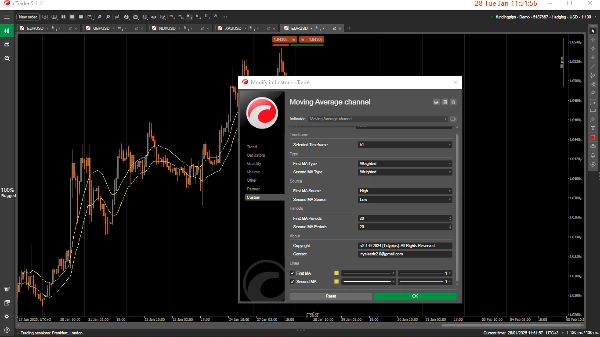
该 WMA 和 SMA 指标 提供了基于用户定义参数可视化移动平均线的灵活性。它支持三种类型的移动平均线: 简单(SMA)、加权(WMA) 和 指数(EMA)。用户可以将这些平均线应用于各种数据源,如 收盘价、开盘价、最高价、最低价,或计算值如 中位数、典型价 和 加权价格。
该工具还允许您选择指标生效的时间范围,确保您专注于特定的数据周期,而不会让图表因不必要的信息而杂乱。
查看我发布的其他有用指标。如果您觉得这个指标或我其他的指标有帮助,欢迎通过购买或捐赠支持我的工作。您的支持不仅帮助我继续开发和改进这些工具,还能确保我持续创造新的、有价值的指标,以提升您的交易体验。感谢您一如既往的支持!
https://buymeacoffee.com/tidypips
指标配置
0.0
评价:0
客户评价
该产品尚无评价。已经试过了?抢先告诉其他人!
cTrader Store 提供的所有产品,包括交易机器人、指标和插件,均由第三方开发者提供,仅供信息参考和技术访问之用。cTrader Store 并非经纪商,不提供投资建议、个人推荐或任何未来业绩保证。
该作者的其他作品


15
销售
4.54K
免费安装